SMS

Understanding SRH-2D No Flow Boundaries

Do you want to understand more about how SRH-2D uses no flow boundaries? Occasionally, you can encounter various challenges regarding no flow boundaries. This post will review how no flow boundaries interact with SRH-2D in order to avoid potential issues with your SRH-2D model.

Examples of no flow boundaries in SRH-2D

SRH-2D includes different types of no flow boundaries such as:

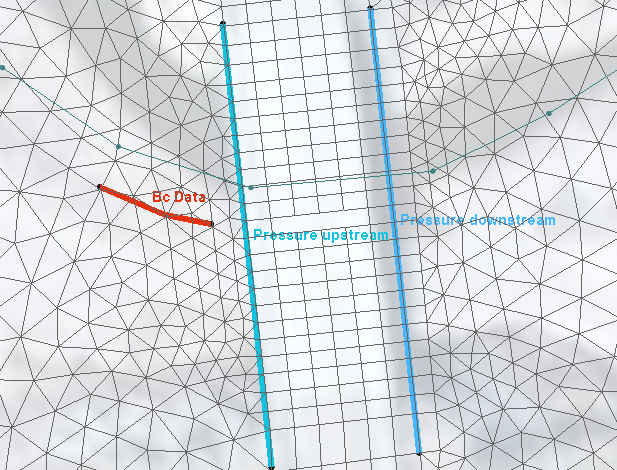
  • Boundary condition arcs assigned to be a "wall".
  • The elements touching a void in a mesh.
  • The boundaries of a mesh that are not assigned to be inflow, outflow, etc.

Make certain to review all of your no flow boundaries. In particular, if you used a shapefile or another coverage to create your boundary condition coverage review all of the arcs on the coverage. In SMS, the default SRH-2D boundary condition is a "wall", so any arcs on the boundary condition coverage that are not meant to be no flow arcs should be changed or removed. A wall arc will snap to the nearest mesh boundary or void boundary. A wall arc should not be used to define an internal no flow area.

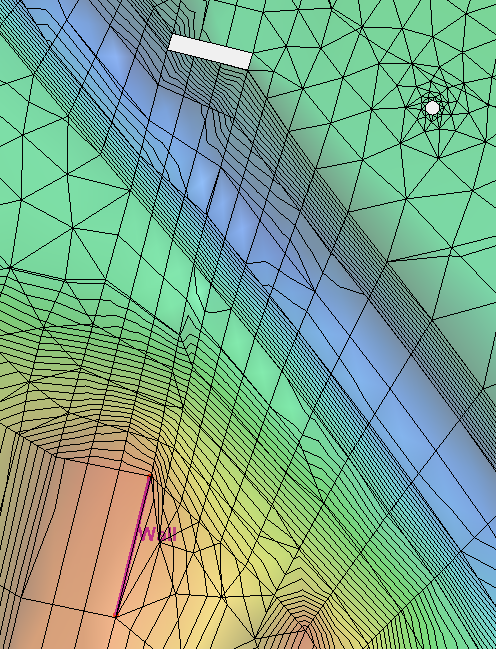
An important aspect to understand for no flow boundaries is that for every element they touch, SRH-2D is essentially being told that water can't flow past the boundary. This changes how SRH-2D computes the flow of water through the model. Large elements that are part of no flow boundaries can impact the model flow more than desired, because the smallest unit SRH-2D can process is a single element. SRH-2D is not designed to assign multiple flow values to a single element.

With this restriction on flow for single elements in mind, large elements can have a disproportionate effect on the model if left in key areas. Therefore, in most cases it is important to make sure that elements around key areas of the model should be more refined. Larger elements should be left in less important areas where they will have less impact.

Now that you understand a little more about no flow boundaries, try out SRH-2D in SMS 13.1 today!

Blog tags: 

Using BCDATA Lines with SRH-2D

Have you needed to modify how SRH-2D calculates flow around a structure? Using BCDATA lines in SMS may be able to help. New to SMS 13.1, the BCDATA line feature lets you specify a location where a water level or flow rate is extracted for a variable boundary condition.

The BCDATA line is primarily used to adjust how flow is calculated going into or leaving a structure. If there is high skew or rapid drawdown at the entry or exit of the structure then you should consider using a BC Data line. It indicates that rather than performing flow computations directly at the site of the structure, they should be performed at the location of the BCDATA line.

There are a few applications for a BCDATA line. For instance, it can be used on a structure such as a weir or culvert. When SRH-2D computes flow through or over a structure, it uses an average water surface elevation. When no BCDATA line is present, SRH-2D computes right along the nodes where the upstream boundary condition arc has been mapped. If an upstream or downstream BCDATA line exists, the water level can be computed there rather than at the actual edges of the structure. The BCDATA line should typically be located one or two cells upstream or downstream from the structure to get out of the zone of influence of the structure itself. This avoids drawdown caused by the flow going through or over the structure.

To create a BCDATA line and assign it to a structure, use the following workflow:

  1. Use the Create Feature Arc tool to create a line a few elements long, ideally about 1 to 2 elements away from the upstream or downstream arc. Create it perpendicular to the arc and along the centerline.
  2. Using the Select Feature Arc tool, select the line you have just created, right-click it, and select Assign BC… to bring up the SRH2D Assign BC dialog.
  3. Set the BC Type to Bc Data. Make sure to provide a label name that is unique in the coverage. Then click OK to close the dialog.
  4. Now select the upstream or downstream arc that is meant to be associated with the BCDATA line, right-click it, and select Assign BC… to bring up the SRH2D Assign BC dialog.
  5. Scroll down to the General structure options section at the bottom. Depending on whether the arc selected is upstream or downstream, check the box by the appropriate BCDATA line option.
  6. Use the drop-down that populates to select the label you previously specified for the BCDATA line. Then click OK to close the dialog.

The BCDATA line will now be assigned to the structure.

Example of a BCDATA Line

It can also be used on a Link or an EXIT-H boundary condition that you have specified using a rating curve. Normally, without a BCDATA line, SRH-2D computes the average flow directly at the line and then extracts the water level from the curve. When a BCDATA line does exist, the flow rate (Q) is computed across the BCDATA line, like a monitor line, rather than exactly at the boundaries.

Try using BCDATA lines with SRH-2D in SMS 13.1 today!

Blog tags: 

Using a Shapefile with the Fast Flood Tool

Do you have a shapefile with water surface elevation data you would like to use towards quickly generating floodplain data? WMS can help you with this. The Map Flood tool, sometimes called the Fast Flood tool, has a new feature we have developed that will allow you to use shapefiles as part of the process of generating floodplain data. This post will review how to use shapefiles for fast flood mapping in WMS.

Using a shapefile with the Map Flood tool can be done by using the following workflow:

  1. Use any of the methods to open files to import your shapefiles into your WMS project. If your shapefile coordinates are geographic, WMS may ask you to convert them to a planimetric coordinate system for computational use, in which case, click OK to accept this.
  2. The shapefile should now be visible under GIS Data. Click on the Map Flood macro to open the Floodplain Mapping Options dialog.
  3. Under the Water Surface Elevations section of the dialog, click on Use FEMA Floodplain Boundary and select your shapefile from its associated drop-down and after making any other changes, click OK to close the dialog.
  4. Example of using a shapefile with the Map Flood tool
  5. The Virtual Earth Map Locator may appear if there is not a set projection. Use it to navigate to the location of your shapefile then click OK after making any other changes. Navigation can either be done by inputting latitude and longitude or typing in the location you wish to observe.
  6. A message may appear saying that the feature requires a global projection. Click OK on this to bring up the Display Projection dialog.
  7. Review the projection to make certain it is correct, click OK to close the Display Projection dialog and run the floodplain delineation.
  8. After the Map Flood tool finishes, you will have all the necessary data downloaded, and the floodplain will have been generated.

Importing a shapefile into the project will have allowed it to be used with the Map Flood tool instead of needing to download the shapefile. This can save you time and provide consistency when generating multiple floodplains using the Map Flood tool. This also allows you to use a shapefile generated from the first use of Map Flood tool for additional floodplain generation in the same area.

Try out using shapefiles for fast flood mapping in WMS 11.1 today!

Blog tags: 

Using SRH-2D Monitor Plots and Structure Plots

With the release of SMS 13.1, we have added the ability to generate monitor plots and structure plots from the solution of a successful SRH-2D model run. This post will offer a brief rundown of these new features and a brief explanation of how to use them.

SMS now has the ability to generate solution plots at monitoring locations or structure locations, using solution datasets generated during the model run. If you make any edits to the coverage after running SRH-2D, make sure to rerun SRH-2D with the updated coverage to keep the plots consistent with the SRH-2D outputs.

For both plots, they will be displayed in an SRH-2D Solution Plots dialog, and they will have similar options in both cases. These options include:

  • Simulations: contains a list of all available simulations where the monitor or boundary conditions coverages were included during the simulation run. Select which solution set to use for the plot.
  • Plots: contains a list of all available solution datasets from the model run. Datasets you select will appear in the plot.
  • Specify time range: specify the time range for the plot to display. The possible range will be from 0 to the length of the entire simulation.

To use the monitor plots:

  1. Make sure you are in the monitor coverage and select a monitoring point or line.
  2. Right-click to select the Monitor Points Plot or Monitor Lines plot command.

This will open the SRH-2D Solution Plots dialog. Note, you need to make sure the monitor coverage was included in the simulation run, and that only one point or line is selected.

To use the structure plots:

  1. Make sure you are in the boundary conditions coverage and select a structure arc.
  2. Right-click to select the Structure Output Plots command.

This will open the SRH-2D Solution Plots dialog. Note that you need to make sure the boundary conditions coverage was included in the simulation run, and that only one structure arc is selected, even for structures that require two arcs.

Structure plot example

Try using monitor plots and structure plots in SMS 13.1 today!

Blog tags: 

Pages