SMS

How SRH-2D and HY-8 Work Together

SMS allows using HY-8 to create culverts in SRH-2D models. HY-8 was created to model culvert profiles. When SRH-2D was being developed, structure boundary conditions were allowed to be linked HY-8 culverts to SRH-2D. Doing this permits SMS to make use of the more robust tools of HY-8 when designing culverts.

When designing a culvert for an SRH-2D model in SMS 13.0:

  1. Right-click on the SRH-2D BC coverage and open the HY-8 Options dialog.
  2. From the dialog, create the HY-8 file for the project.
  3. On the SRH-2D BC coverage, create two arcs for the culvert: one for the inlet side of the culvert and one for the outlet side.
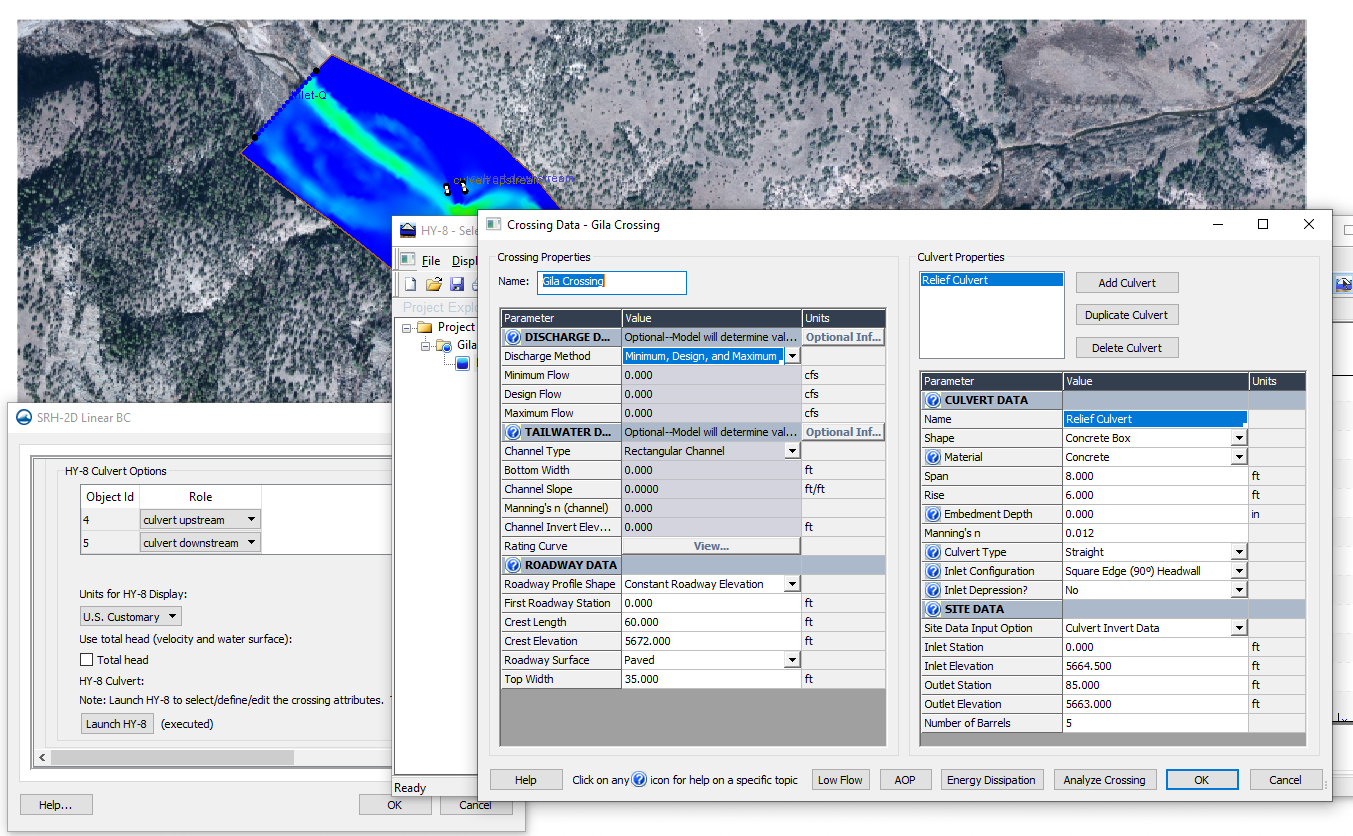
  4. Select both arcs and open the SRH-2D Linear BC dialog.
  5. In the dialog, select the Culvert HY-8 option and launch HY-8 to connect the HY-8 file.
  6. In HY-8 design your culvert.
HY-8 with SRH-2D

There are a few items to keep in mind when creating your culvert:

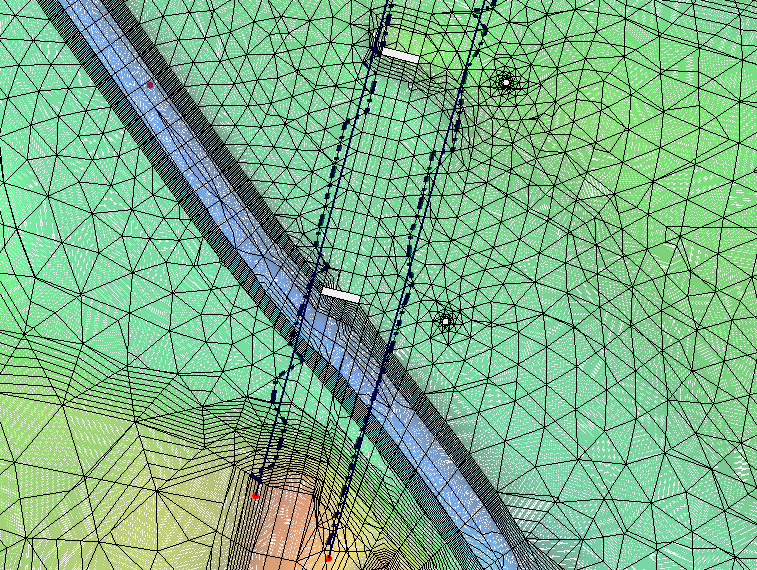
  • Pay attention to where the culvert is located and how it snaps to the mesh in SMS. Designing your culvert for a location that doesn’t match up with your culvert is designed in HY-8 can cause discrepancies. Also, it helps to have the inflow entering the culvert at as close to a 90 degree angle as possible.
  • Note that the crest length for constant elevation roadway profiles is the length between embankments.
  • After the initial model run, the inflow values to the culvert may need to be adjusted and calibrated. If SRH-2D is showing lower or higher flow values, adjust the values in HY-8 as needed.
  • Using a monitor line at the inlet or outlet side of the culvert. The results of the monitor lines may be different than what HY-8 reports. Use this difference to calibrate the model.
  • 2D mesh elements are disabled between the culvert arcs during the model run.

HY-8 makes a great addition to SRH-2D in SMS. HY-8 is shipped with SMS, so feel free to try it out with your models today!

Blog tags: 

Observation Arcs vs. SRH-2D Monitoring Lines

Have you ever wondered what is the difference between using an observation arc and using an SRH-2D monitoring line? Both make use of arcs drawn on map coverages and both are used to show the results of a model run. While they serve a similar purpose, there are significant differences between the two. This article will discuss some of these differences.

Observation Arcs

Observation arcs are made on an observation map coverage. This generic coverage can be used with nearly every numeric model in SMS. It is not specific to only SRH-2D. Observation arcs can be used to generate a profile plot based on the model run results. SMS does this by interpolating the results to locations along the observation arc.

An observation arc can be created before or after the model run. The arc can also be adjusted after the model run to change what is shown in an observation plot.

SRH-2D Monitoring Lines

SRH-2D monitoring lines are created on an SRH-2D monitor coverage. This is an SRH-2D specific coverage that will only work with an SRH-2D simulation. The monitor coverage must be included in the SRH-2D simulation during the simulation run in order for the monitoring lines to produce results. A plot from the monitor line can be viewed in the Simulation Run Queue during the model run.

When creating monitoring lines, arcs are drawn on the SRH-2D monitor coverage. It is important to pay attention to how these arcs snap to the SRH-2D mesh. Monitoring lines will follow the nodes of the mesh instead of interpolating to the location of the arc. For SRH-2D, this makes the results of the monitoring lines more accurate than observation arcs.

SHR-2D monitor lines snappingto mesh nodes

The results from the monitoring lines are found in the the *.dat file that starts with “LN”. If a change is made to a monitoring line after the simulation run, the simulation will need to be saved and run again to get the new results for the monitoring line.

Using both monitoring lines and observation arcs is common for many projects. Keeping in mind the differences will help you make better use of both of them. Try using observation arcs and monitoring lines in SMS today!

Blog tags: 

Scalar/Vector Conversion in SMS

Datasets in SMS can be rendered as either scalar or vector data. Furthermore, SMS allows you to convert datasets between scalar and vector using either a right-click menu command or the Dataset Toolbox.

In the Project Explorer, the icon next to the dataset will show if it is a scalar or a vector dataset. In SMS, scalar datasets typically represent water surface elevation, depth, and magnitude. Vector datasets typically represent flow velocities and observed wind fields in the area.

When converting a scalar dataset to a vector dataset, two scalar datasets are needed. The scalar datasets need to be either magnitude and direction data, or x and y components. When converting vector data to scalar data, the result will be one or more datasets.

Converting Datasets with the Right-Click Menu

To convert a vector dataset to a scalar dataset, do the following:

  1. Right-click on the desired vector dataset in the Project Explorer.
  2. Select Vector to Scalars.
  3. After the dialog appears, options are available for the specification of either magnitude and direction or x and y components for the resulting scalar datasets.
Vector to scalar using the right-click menu

To convert scalar dataset to a vector dataset, do the following:

  1. Select two scalar datasets: either magnitude and direction or x and y components.
  2. Right-click and select Scalars to Vectors.
  3. In the dialog that appears, confirm that the components have been assigned correctly.

Note that if only one scalar dataset is selected, another dialog will appear asking you to select the second scalar dataset.

Converting Datasets with the Dataset Toolbox

The Dataset Toolbox can also be used to convert scalar datasets into vector datasets or vector datasets to scalar datasets. To do this:

  1. Click on the dataset in the Project Explorer to make it active.
  2. Select Data | Dataset Toolbox... This will bring up the Dataset Toolbox where options will be made available that are relative to the altering of the dataset.
  3. Navigate to the Tools section of the dialog and select either Scalar to Vector or Vector to Scalar.
  4. For the Scalar to Vector tool, select the dataset components to use.
  5. For the Vector to Scalar tool, select whether you want the dataset to be magnitude and velocity, or x and y components in the Options section of the dialog.
Vector to scalar using the Dataset Toolbox

The Dataset Toolbox also contains many other tools. Try them out in SMS today!

Blog tags: 

Exporting SRH-2D Results

After completing an SHR-2D model in SMS, are you needing to export the results so that they can be examined by someone not using SMS? SMS provides a few different ways that SHR-2D results can be exported.

ASCII and Binary

The simplest method of exporting SRH-2D results is to export them as either a generic ASCII file or binary file. This is done by doing the following:

  1. In the Project Explorer, right-click on the SRH-2D solution dataset and select Export.
  2. In the Export dialog, select to export the dataset as either a generic ASCII file or a generic binary file.
Shapefile

Shapefiles can be opened by a multitude of programs, making it a useful format to use when sharing your results. To export a dataset as a shapefile, do the following:

  1. In the Project Explorer, select the solution dataset and time step you want to export.
  2. Use the File | Save As command.
  3. In the Save As dialog, change the File Type to be "Shapefile (*.shp)".

The dataset can then be saved using the mesh contours to create either an arch shapefile or a polygon shapefile.

Raster

Raster files are also a file format that can be used by many different programs. To convert your SRH-2D solution sets into a raster file, do the following:

  1. Convert the mesh with the solution sets into a scatter set by using the Data | Mesh to Scatterpoint command.
  2. Select the desired dataset and time step under the converted scatter set.
  3. Right-click on the scatter set and select Convert | Scatter to Raster.
  4. Save out the raster file.
Text File

A delimited text file allows you more control over what is exported. To export your solution set as a text file:

  1. Select the File | Save As command.
  2. In the Save As dialog, change the File Type to be "Tabular Data Files (*.txt)".
  3. Use the Export Tabular Data dialog to specify how the file will be set up, which datasets to export, and which time steps to use.
Exporting SRH-2D datasets as a text file

These are just a few of the ways that SHR-2D solution files could be exported. After exporting the solution set, follow the user guidelines for importing the file into other software. Other file export options are also available, try them out in SMS today!

Blog tags: 

Pages