We use cookies to make your experience better. To comply with the new e-Privacy directive, we need to ask for your consent to set the cookies. Learn more.

Using the Plot Data Coverage
Have you generated a plot in SMS and found it was difficult to see where a bridge, culvert, or other structure location matched up with the plot? The Plot Data coverage helps make them more visible, making an observation coverage more meaningful in a profile plot.
Typically, a profile shows some desired value such as water surface elevation or the riverbed elevation. This data can be more useful in many cases if structures are displayed on the plot as well. A Plot Data coverage allows creating polygons over structures that then helps display the location of the structure on the plot profile.
To use the Plot Data coverage, do the following:
- In the Map Module, create a new coverage with the Plot Data type.
- In this new Plot Data coverage, create a polygon over the area of interest.
- Double-click on the Polygon to assign attributes in the Plot Data dialog.
- Create an observation arc that includes the area of interest.
- Create an observation profile plot.
- In the Plot Data Options, turn on the Plot Data coverage.
The profile plot will now show where the polygon on the Plot Data coverage aligns with the profile.
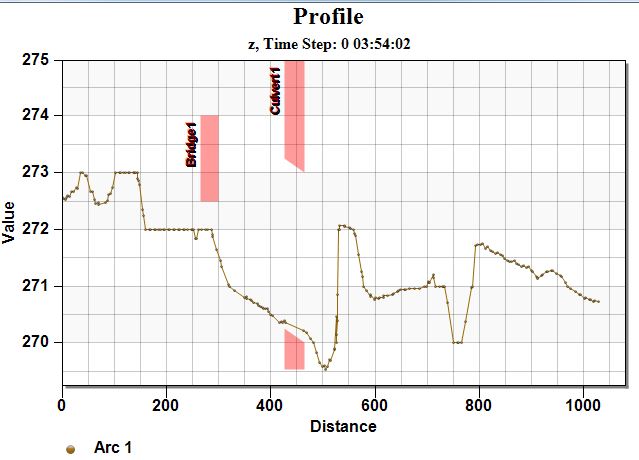
For example, if you want to consider the impact of a new bridge placement on the flow of a river, you could create a polygon representing the bridge location. When included in the profile, this could help you visualize placing a bridge at that location along the river and at the indicated height. If water elevation data is available, such as from an SRH 2D simulation, the height of the bridge can be easily compared with elevation profile of the water surface. This could be helpful in considering if the bridge would be washed out or flooded during periods of heavy rain when the river swells.
Culverts can similarly be shown on the profile by using the Plot Data coverage. Likewise, obstructions or structures of any shape could also be shown in the profile using the Plot Data coverage. Multiple plot data coverages could be used when there is a desire to layer structures such as a hypothetical bridge and the supporting abutments or columns.
Try out using the Plot Data coverage in SMS today!
June 5, 2019
|
View: 2765
|
Categories: SMS
|
By: <a class="mp-info" href="https://aquaveo.com/blog/author/admin">Aquaveo Staff</a>
About the Author

Performing a Silent Install of XMS (Passwords & Hardware Locks)
October 10, 2018
Converting a NET File to an INP File
May 9, 2018
Computing Basin Curve Numbers in 9 Easy Steps
May 16, 2023
Performing a Silent Install for ALS
October 27, 2021
Tips for Finding Information on the XMS Wiki
September 25, 2019
Tips for Using Wells with MODFLOW 6
July 14, 2026
Enhanced Arc Geometry and Vertex Tools
July 7, 2026
SRH-2D Inflow & Outflow Best Practices
June 30, 2026
Troubleshooting Projection and Coordinate System Issues
June 23, 2026