We use cookies to make your experience better. To comply with the new e-Privacy directive, we need to ask for your consent to set the cookies. Learn more.

Viewing Flood Extents in SMS
For many riverine projects, finding areas of potential flooding is a key component. SMS offers a few ways to see the flood extents in a given project.
When running a riverine numeric model, such as SRH-2D, a dataset of the water surface elevation (WSE) is often part of the resulting solution. Using the contours and time steps of the WSE dataset can help locate the flooded areas and extents within the modeled area.
You can use the “max” function in the data calculator to make a dataset showing the maximum water surface elevation across all timesteps. For example, using a WSE dataset, you would enter "max(WSE:all)" to get the maximum value for the WSE dataset across all time steps. This would then show the maximum extents.
A faster way to view floodplain data for a single time step is to use the Map Flood command. This tool utilizes ground elevations and existing flood hazard maps from the Federal Emergency Management Agency (FEMA) to quickly visualize the impacts of possible modifications in the flood level. The Map Flood tool works with FEMA flood hazard data allowing you to avoid building and running an entire numeric model in order to obtain a quick estimate of the flood areas for a single time step.
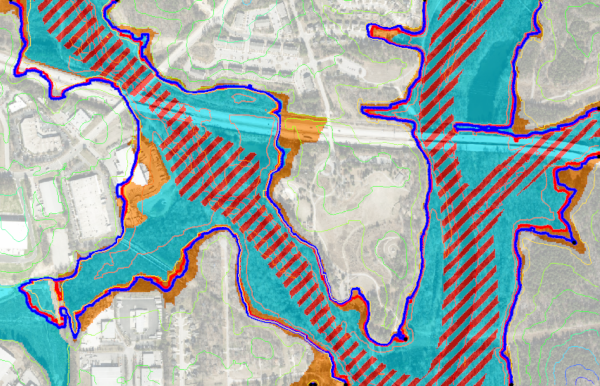
The Map Flood tool can also be used for a single time step with local data for areas where FEMA data is not available. More information about the Map Flood tool is found in the Fast Floodplain tutorial.
You can share the flood data you’ve generated by exporting a WSE or max WSE dataset in a variety of file formats using either the right-click Export command or the File | Save As command. The feature arcs created using the Map Flood can also be saved as a shapefile or any other available file format.
Try out the tools in SMS for viewing flood extents today.
January 22, 2020
|
View: 2237
|
Categories: SMS
|
By: <a class="mp-info" href="https://aquaveo.com/blog/author/admin">Aquaveo Staff</a>
About the Author

Performing a Silent Install of XMS (Passwords & Hardware Locks)
October 10, 2018
Computing Basin Curve Numbers in 9 Easy Steps
May 16, 2023
Converting a NET File to an INP File
May 9, 2018
Performing a Silent Install for ALS
October 27, 2021
Tips for Finding Information on the XMS Wiki
September 25, 2019
Best Practices for Modeling Complex Geometries
April 28, 2026
Managing MODFLOW 6 Data: Lists, Copy Period & CSVs
April 21, 2026
5 Concepts for Mastering Surface-water Modeling
April 14, 2026
Comparing Multiple Design Alternatives in One Project
April 7, 2026
Incorporating MODFLOW 6 Groundwater Energy (GWE)
March 31, 2026