We use cookies to make your experience better. To comply with the new e-Privacy directive, we need to ask for your consent to set the cookies. Learn more.

Using the Axes Display in GMS
Have you tried using plotted axes to help orient the display of your models in the Graphics Window for your groundwater modeling projects in GMS? Within the Display Options in GMS, there is a set of options that will allow users to activate this and modify how it will display. This post will review how to utilize the Plot Axes functionality found in the Display Options dialog within GMS.
To locate the Axes options in GMS, open up the Display Options dialog by doing the following:
- Click the Display Options macro or go to the Display | Display Options... command.
- Select the Axes option on the left.
- Turn on the checkbox labeled "Enable axes" to activate the plot axes.
By default, the axes are turned off, and all the other options below it grayed out as a result. This is why axes are not usually visible on their own in the Graphics Window. Turning this option on will generate axes within the Graphics Window. The axes will naturally be sized to contain the entirety of the model within it. If the Graphics Window is currently set to Plan, Front, or Side View, rotation might be required for all of the axes to be visible.
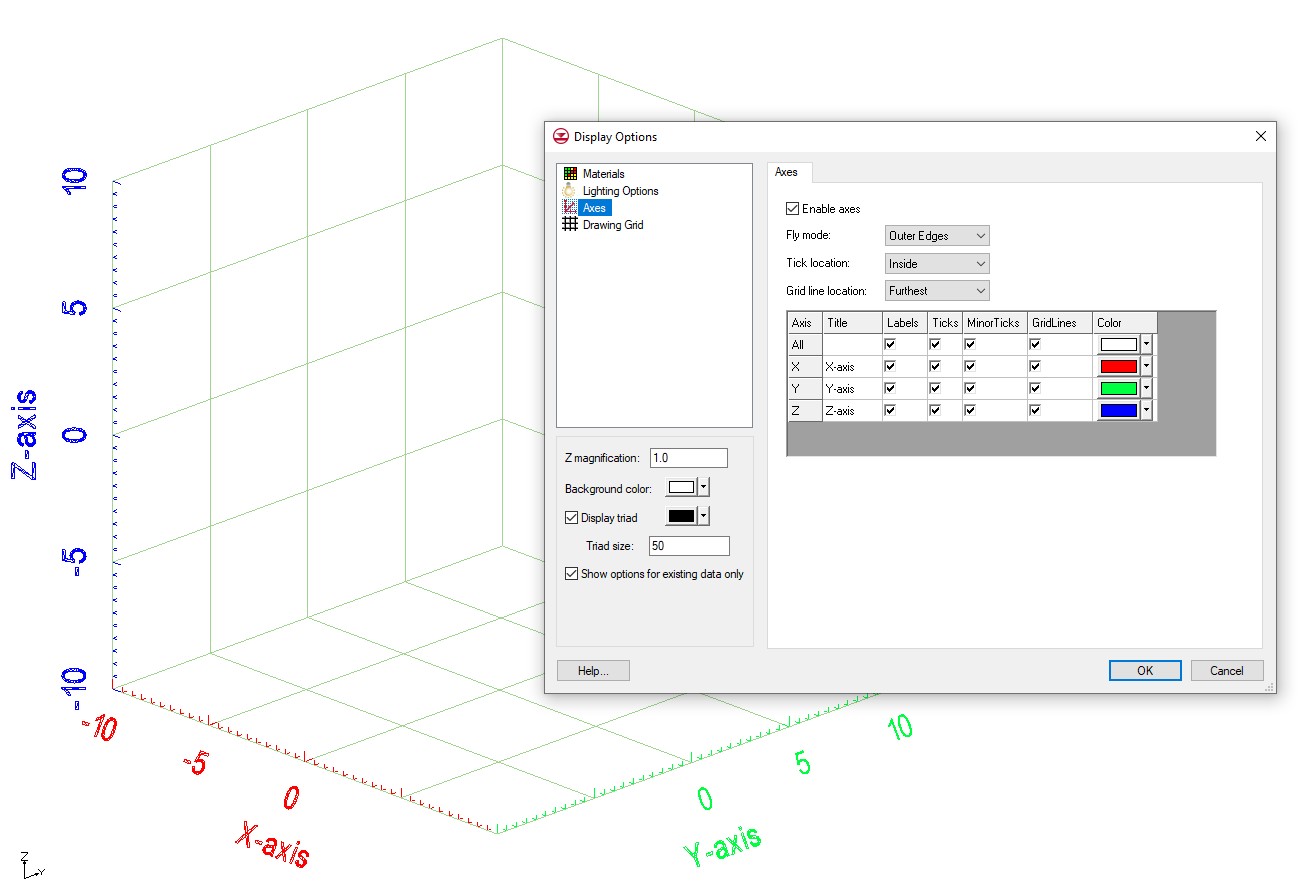
The Axes display options allow you to control the different aspects of the axes display, such as:
- Fly modes to set where in space the axes will be placed.
- Tick location options to set which direction tick lines along the axes will be drawn pointing to, either inward or outward.
- Grid line location options to set which surfaces grid lines are actually drawn on, which can help in visualizing the grid.
- A spreadsheet containing options for editing each individual axis, as well as a row for editing all of them at once.
Try out experimenting with Axes display options in GMS 10.5 today!
November 3, 2021
|
View: 1753
|
Categories: GMS
|
By: <a class="mp-info" href="https://aquaveo.com/blog/author/admin">Aquaveo Staff</a>
About the Author

Performing a Silent Install of XMS (Passwords & Hardware Locks)
October 10, 2018
Computing Basin Curve Numbers in 9 Easy Steps
May 16, 2023
Converting a NET File to an INP File
May 9, 2018
Performing a Silent Install for ALS
October 27, 2021
Tips for Finding Information on the XMS Wiki
September 25, 2019
Comparing Multiple Design Alternatives in One Project
April 7, 2026
Incorporating MODFLOW 6 Groundwater Energy (GWE)
March 31, 2026
Essential DEM Clean-Up for Watershed Delineation
March 24, 2026
Essential Boundary Condition Guide
March 17, 2026
How to Delineate a Well Capture Zone Using MODPATH
March 10, 2026