We use cookies to make your experience better. To comply with the new e-Privacy directive, we need to ask for your consent to set the cookies. Learn more.

Plotting Observed Data onto a Computed Time Series Plot
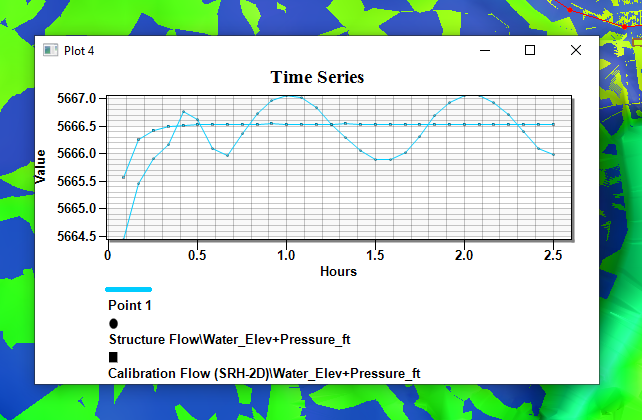
Have you been wanting to make a direct graphical comparison of observed time series water-level data with computed time series water-level data? Have you been hoping to use data observed in the field to help calibrate your 2D hydraulic model in this way? While not officially supported yet, we have a workaround that could potentially help with this. This post will review how to plot both observed and computed water-level data onto the same time series plot.
There is no direct method for plotting observed data onto a computed time series graph. However, the following workflow should be able to suffice as a solution:
- From within SMS, bring up the File Import Wizard by using File | Open to select the file for your observed time series data.
- On Step 2 of the File Import Wizard, set the SMS data type drop-down to "Scatter Set", and once properly configured, click Finish to close the File Import Wizard and import the observed time series data into SMS as a scatter set.
- Once the data has been imported, interpolate the scatter set to your mesh by right-clicking on the scatter set and selecting the Interpolate to... command to bring up the Interpolation Options dialog.
- Select the scatter set data you would like and the mesh you would like to interpolate the data to, and click OK to close the dialog and interpolate.
- Click the Plot Wizard macro to bring up Step 1 of the Plot Wizard dialog.
- Select "Time Series" from the Plot Type list and click Next > to move on to Step 2 of the Plot Wizard.
- Select "Use selected datasets" and then click the All Off button underneath it. This will now allow you to select which specific datasets you would like to appear on the graph.
- Click Finish to close the Plot Wizard and bring up the Plot Window. The graph you have specified should appear.
- To further modify the graph, right-click on it and select Plot Data... to bring up the Data Options dialog. This will allow you to get back to the previous options and change your selection of datasets.
A future version of SMS may incorporate a more direct method for this process. But don’t let that stop you from trying out plotting observed data onto a computed time series plot in SMS 13.1 today!
November 10, 2021
|
View: 2154
|
Categories: SMS
|
By: <a class="mp-info" href="https://aquaveo.com/blog/author/admin">Aquaveo Staff</a>
About the Author

Performing a Silent Install of XMS (Passwords & Hardware Locks)
October 10, 2018
Computing Basin Curve Numbers in 9 Easy Steps
May 16, 2023
Converting a NET File to an INP File
May 9, 2018
Performing a Silent Install for ALS
October 27, 2021
Tips for Finding Information on the XMS Wiki
September 25, 2019
Incorporating MODFLOW 6 Groundwater Energy (GWE)
March 31, 2026
Essential DEM Clean-Up for Watershed Delineation
March 24, 2026
Essential Boundary Condition Guide
March 17, 2026
How to Delineate a Well Capture Zone Using MODPATH
March 10, 2026
How to Decide between Structured or Unstructured Grids
March 3, 2026