We use cookies to make your experience better. To comply with the new e-Privacy directive, we need to ask for your consent to set the cookies. Learn more.

Viewing SRH-2D Simulation Plots
SMS generates multiple plots during the SRH-2D model run. These solution plots include data collected by monitor points or lines as well as information such as mass balance and percentage of flow that enters the simulation. This post will discuss accessing and using the solution plots.
The first way to view the SRH-2D Solution plots is through the simulation data in the Simulation Run Queue. This allows you to look at the quality of the simulation as it is running. In the Simulation Run Queue, the Monitoring data option needs to be turned on. You can then view the plots as they are generated using the tabs below.
After you have run the simulation, you can view the solutions plots. You can access the SRH-2D Solution Plot by doing the following:
- Right-clicking on the simulation item and select Tools from the dropdown to open another submenu.
- Click on View Simulation Plots to pull up the SRH-2D Solution Plots window.
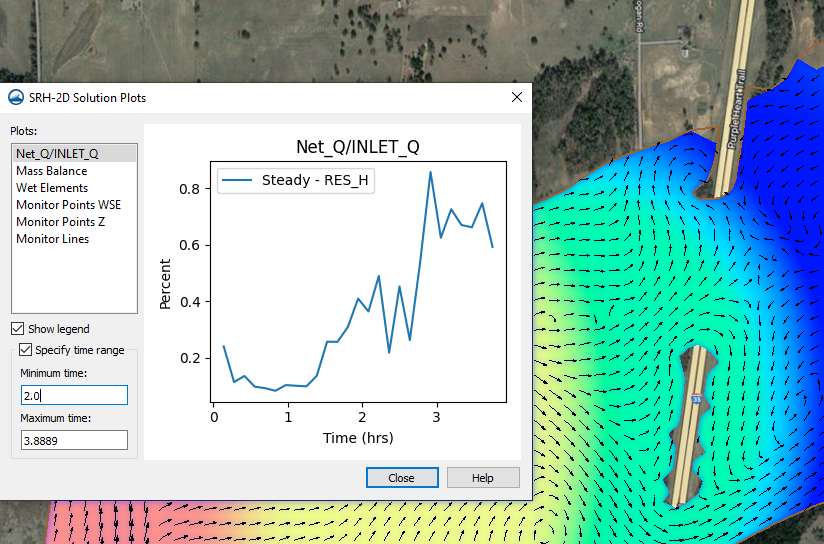
This will allow you to look at the list of different plots in the Plots section. On the left, there are a few other options such as the legend, and specifying the time range. The show legend option will have a legend appear in the upper right corner of the plot that has been pulled up. This as well as the specifying of the time range allows you to adjust the graph to your desired time range.
It is important to note that the plots in the Solution Plot window are not available in the Plot Wizard. You will need access them through the Solution Plots window. With that, it should be noted that pulling up an older SRH-2D project in a current version of SMS may not have the solution plots. This is because of changes in how files are organized. In this case, the solutions plots can be generated by re-running the simulation.
The SRH-2D Solution Plot is one of the many options in SMS to help you see what is happening in your simulation. Try using the SRH-2D Solution Plot in SMS today!
February 21, 2023
|
View: 2533
|
Categories: SMS
|
By: <a class="mp-info" href="https://aquaveo.com/blog/author/admin">Aquaveo Staff</a>
About the Author

Performing a Silent Install of XMS (Passwords & Hardware Locks)
October 10, 2018
Computing Basin Curve Numbers in 9 Easy Steps
May 16, 2023
Converting a NET File to an INP File
May 9, 2018
Performing a Silent Install for ALS
October 27, 2021
Tips for Finding Information on the XMS Wiki
September 25, 2019
Comparing Multiple Design Alternatives in One Project
April 7, 2026
Incorporating MODFLOW 6 Groundwater Energy (GWE)
March 31, 2026
Essential DEM Clean-Up for Watershed Delineation
March 24, 2026
Essential Boundary Condition Guide
March 17, 2026
How to Delineate a Well Capture Zone Using MODPATH
March 10, 2026