Aquaveo & Water Resources Engineering News

3 Ways to Download Images in WMS

Many projects start with an image, because we like to see what we’ll be working on. It’s always possible to import an image file, but if you don’t already have an image file, then what? Well, when WMS is able to access the internet, it can download an image for you.

The advantages of online images are that they can be seamlessly integrated into projects, data is available for locations throughout the world, and they can be reprojected to the display projection without needing to georeference the image.

To download an image, WMS provides three tools: Get Online Maps, Get Data From Map, and the Get Data tool.

1. Use the Get Online Maps Tool

The Get Online Maps tool connects to a data server where real world images and data can be downloaded into your project. To use the Get Online Maps tool:

  1. Click on the Get Online Maps macro . This will bring up the Virtual Earth Map Locator dialog, if there is not a projection already set in the project.
  2. In the Virtual Earth Map Locator dialog, find the location where you want to retrieve data.
  3. Next, the Get Online Maps dialog appears where you select which type of data you want to retrieve, (i.e., a topographic map or elevation data).
  4. Download the image.

The downloaded image is a dynamic image. This means it will redownload data when you zoom in or out in WMS. The image has not been saved locally at this point. To save:

  1. Right-click and select Export.
  2. Use the Resample and Export Raster dialog.
  3. Enter the file name.

This saves a static image to your hard drive. It can then be used again in the future.

2. Use the Get Data From Map Tool

If you don’t want to get a dynamic image, you can skip directly to downloading a static image. To do this:

  1. Click on the Get Data From Map icon to bring up the Virtual Earth Map Locator.
  2. Select the desired location in the Virtual Earth Map Locator dialog. If you have a projection set or have previously downloaded an image, this dialog will be show that area.
  3. The Data Services Options dialog will appear next. Select the type of data you want to retrieve.
  4. WMS will then ask you to save the file as a static image before downloading the data into your project.

With the Get Data From Map tool, you have a static image ready for use in your project with the file available for other projects if needed.

3. Use the Get Data Tool

The Get Data tool allows you to retrieve an image for a specific location in your project. The project display projection must be set to an appropriate “Global projection” option for this to work.

  1. Select the Get Data icon and draw a box in the Graphics Window to select the desired area for the image.
  2. Select a data type in the Data Services Options dialog.
  3. You will then be asked to save the file as a static image.

Now you will have image data that only covers the area you drew out in the first step. This is helpful when you only need a specific piece of data, or data only for a specific location.

Try out these three ways to download image data in WMS today. We recommend experimenting a little so you can learn all the different ways these images can be used.

  • Note that in 2017, the server used by the WMS online map tools was discontinued by Microsoft. A new server has been selected and is used in the current version of WMS. Because of this, older versions of WMS may not be able to use the online map tools.
Blog tags: 

Tracing Municipal Water System Flow

Contaminants getting your municipal water system down? Using CityWater to create an animation tracing the flow of water through the system could help resolve this.

Tracing the flow of water through a municipal pipe system can help with figuring out how quickly a contaminant can propagate through the system, and also figuring out the general flow pattern of water throughout the system.

Some of the biggest concerns on city water manager minds in the last few years are preventing contamination in water systems and figuring out how quickly a contaminant spreads if water system integrity is compromised. Mention contaminated water, and examples such as the problems in Flint, Michigan come immediately to mind.

Contaminants can enter the system many different ways, including through broken pipes or leaching off the pipes themselves. If the pressure within a water system fluctuates too much, even a small break in a pipe can pull in any contaminants in the area. Using a trace animation in CityWater can provide a baseline for how far the contaminant may have gone.

It can also be important to know the flow from a particular location to anywhere else within the water system. This can be used to determine how quickly a flush of the system occurs, for example, and it provides a visual way to show the flow instead of looking at charts of numbers. It could also be used to determine what parts of the water system will be impacted by the introduction of a new pump or tank.

A trace animation can be generated in CityWater by doing the following:

  1. Open the map for the project.
  2. Select “Quality” for both Node and Link Layers.
  3. Click on the Animate Layers icon at the bottom right (below the legend).

This requires that the Quality Method parameter is set to TRACE and the Quality Trace Node is defined in Global Options. To do this:

  1. Go to your Project Details page.
  2. Select the Model Options tab.
  3. Edit the Global Options to turn on the TRACE option and define the Quality Trace Node.

Try creating trace flow animations in CityWater today by going to the Aquaveo Portal. Use “trycitywater” as the username and password.

Blog tags: 

Using Zonal Classification in SMS

Needing to identify part of your model that is prone to flooding? Or do areas of your project need to be marked off as a fish habitat?

While there are many tools in SMS that can be used to designate areas of a project as something different, one of the easier ways is to use Zonal Classification tool.

  1. Begin with opening your project containing scalar data. The scalar data can be loaded into the Scatter module, or be part of a 2D mesh or 2D grid.

  2. Next, open the Zonal Classification tool. Do this by selecting the Zonal Classification menu command in the Data menu in either the Scatter, Mesh, or Grid module.


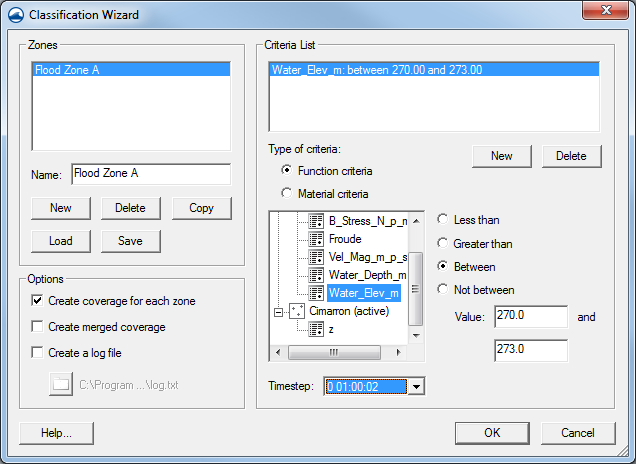
  3. Once the Zonal Classification dialog is open, start setting criteria to define your zones. In the section titled “Zones”, click the New button to create your zone. You can define multiple zones at once while in the dialog.

  4. Once you’ve created your zones, you can define the criteria for each zone. Select the zone and click the New button in the Criteria List section. The criteria can be one of two types: a function criteria or a material criteria.

    As you’ve probably guessed, function criteria use a formula you specify to create the zone. Say you want to identify areas on your mesh below an elevation of 50 feet because those are areas you need to mark off as being prone to flooding. You’ll select the Function criteria option, select your elevation dataset, check the Less than option and enter a Value of 50.

    Similarly, you can choose to create zones based on materials. The materials need to have already been defined in the project before this option can be used. Once the materials are defined, you can create zones that either include or exclude areas of your projects where the zones overlap your scalar data.

  5. Finally, once, you’ve defined your criteria, you can have SMS create a new map coverage with polygons around the defined zone areas.

Try using zonal classification in SMS today!

Blog tags: 

Adding Notes in GMS

It happens from time to time—part of your groundwater model has something special that needs mentioning before handing it over to someone else. You may want to differentiate between two similar coverages without giving them long names, you may need to describe the real world source of a scatter set, or you need to explain how a quadtree was generated.

GMS provides an effective way to add notes to objects and datasets in order to aid in model development. There are two ways to add notes to objects in GMS.

The first is to add notes to object properties by doing the following:

  1. Right-click on an object in the Project Explorer and select the Properties command.
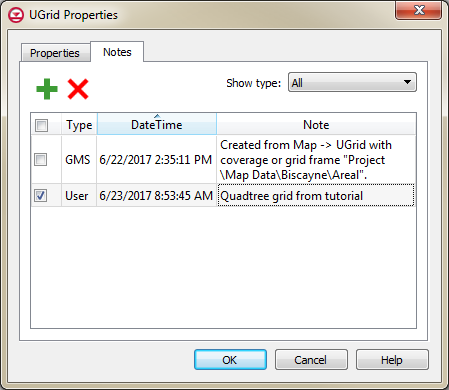
  2. In the Properties dialog, click on the Notes to tab to see all notes associated with the object.
  3. Click on the Add Row button to create a row where you can add your notes. The date and time you enter the note will automatically be added.

GMS can also automatically create notes when UGrids, datasets, and coverages are created. Using this feature requires that the Create GMS Notes Automatically option be turned on in the Preferences dialog.

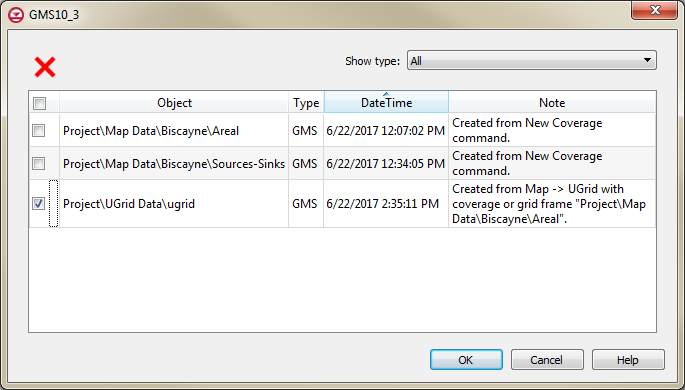
As your project grows, you may find some notes are no longer needed. You can delete notes by going into the Properties dialog and deleting notes individual. If you have several notes that need to be removed, deleting them individually could be a hassle. GMS makes it easier by placing all notes contained in a project into one location.

  1. Select the Notes command in the Edit menu to bring up a dialog with all notes made in the project.
  2. From this dialog, you can select and delete multiple unwanted notes.

Now that you’ve seen how to create notes, try adding notes to your projects in GMS 10.3.

Blog tags: