Aquaveo & Water Resources Engineering News

Defining Hydraulic Conductivity for Specific Layers

In your groundwater model, do you need to define hydraulic conductivity for specific layers differently than other layers? Do you need to modify the hydraulic conductivity values for specific areas within a single layer? GMS provides more than one way to assign hydraulic conductivity. This capability gives you more precision with regard to how hydraulic conductivity is assigned to your groundwater model.

Using the conceptual model approach, hydraulic conductivity can be assigned to polygons on a single coverage then mapped to your model. You can also use multiple coverages, assigning the hydraulic conductivity to specific layers ranges. The workflow for this is as follows:

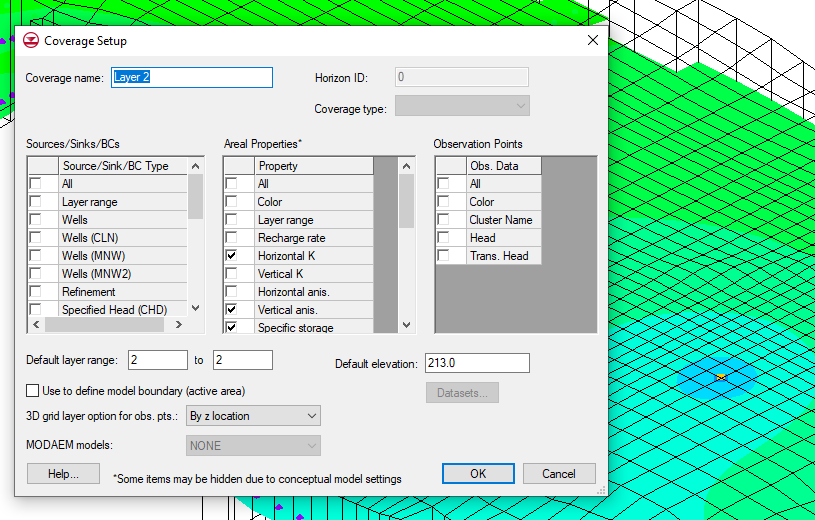
  1. Right-click on the coverage and select "Coverage Setup...".
  2. In the "Default Layer range" set the layer range you would like to use.
  3. Coverage setup for conductivity on a specific layer
  4. Select the coverage to make it active.
  5. Double-click on a polygon within the coverage.
  6. It will bring up the attribute table for that group of layers.
  7. Set the conductivity for the polygon.
  8. Repeat this process for each desired group of layers.
When using this workflow, take care to make certain you are setting the correct attributes to the correct layer of your grid. Naming the coverage with the layer number or layer range can help with this process. You may also want to use the notes feature to attach reminders as to how the coverage has been set up.

It should be noted that when mapping multiple coverages to your grid, GMS follows an order of priority for the coverages. If you have different conductivity values on different coverages that overlap it is recommended that you apply the coverages individually. The last coverage that you apply will overwrite any overlapping values. If you apply all the coverages at once, the conductivity values will be summed up in areas where they overlap.

Try out using multiple coverages to define hydraulic conductivity for specific layers in GMS today!
Blog tags: 

Using the Database Import Wizard in WMS

Do you have data stored in a database that you would like to import into your WMS project? Occasionally you might find yourself with a database that needs to be imported into your WMS project. This might be a geodatabase or some other sort of database containing GIS data that WMS does not recognize natively.

To import a database, WMS uses the Import Database Wizard. The wizard is accessed through the Import From Database command in the File menu. Once the wizard has been launched, there are a few steps you need to follow.

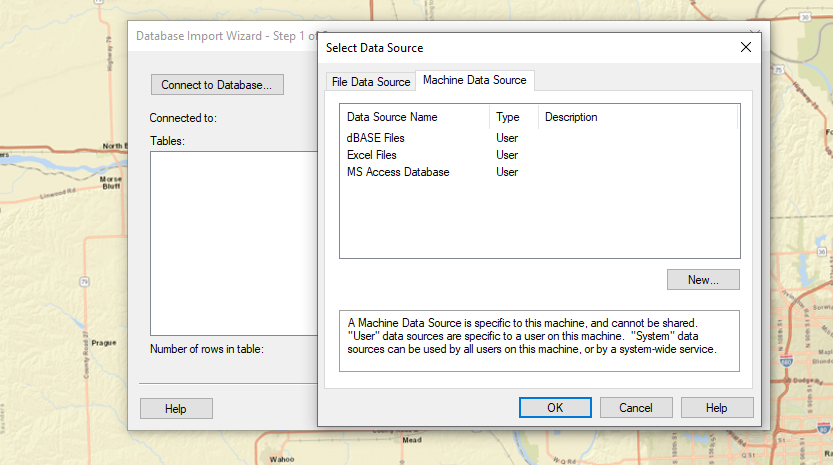
  1. Connect to a database. Use the Connect to Database button to connect to a database located on your computer or on a network. A preview of the database will be displayed in the tables in the wizard.
  2. The Import Database Wizard
  3. Query information from a database table. You will have the option to create, copy, delete and import queries that retrieve data from the database. The query uses basic SQL statements which can be entered in the provided fields.
  4. View results of the query. The results of the database query are displayed for you to review. If the results are not what you expected, you will have the option to return to the previous step to fix the issues.
  5. Assign column type. You can select the kind of data that will be imported into WMS. The kind of data should be of the file types supported by WMS. There is also the option to set files as "no data".

After the data has been imported into your project, you can make use of the coordinate transformation tools in WMS to transform or translate the data if necessary.

If you have a database with data you would like to import into WMS, try using the Import Database Wizard in WMS today!

Blog tags: 

Understanding the Smooth Datasets Tool in SMS

Do you have a dataset, or survey data, that has random distances between points which you would like to have a more uniform distribution? SMS contains a tool that allows you to smooth data. By using the Smooth Datasets tool you can create a new dataset that has a more even distribution.

To use the Smooth Dataset tool, do the following:

  1. Make certain you have the Scatter module containing the dataset active. If your dataset is in a different geometry, it may need to be converted to a scatter set.
  2. Use the Dataset Toolbox command in the Data menu to open the Dataset Toolbox.
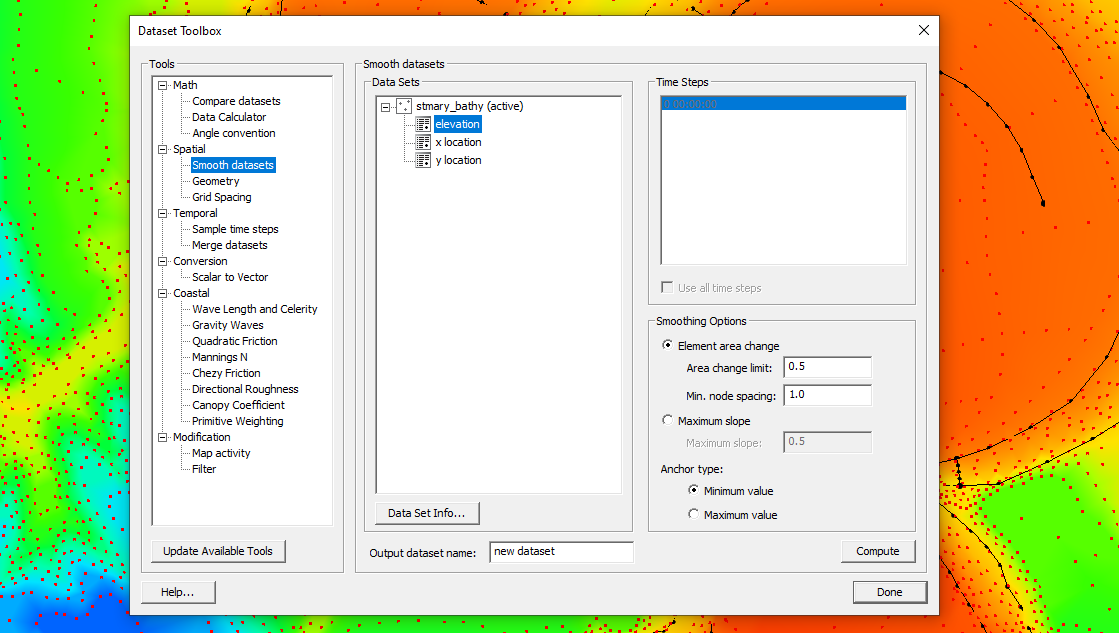
  3. Select the Smooth Dataset tool under the list of tools.
  4. Enter the parameters for smoothing the dataset.
The Smooth Datasets tool in the Dataset Toolbox

When using the Smooth Dataset tool there are a few items to keep in mind:

  • There are no restrictions related to X or Y point distribution. In other words, the dataset points don’t need to align with a grid.
  • The "Element Area Change" option is only recommended when smoothing size functions for certain meshing methods (i.e. scalar paving).
  • When smoothing elevations, the "Maximum slope" method is recommended. This function works with any scalar dataset, but I will assume elevation as the dataset for this explanation.
  • When using the "Maximum slope" method, the elevation of a starting point is compared with its neighboring points (connected via triangles). The elevation of a neighboring point is adjusted if the slope between the points exceeds the specified maximum.
  • The "Anchor type" determines the starting point.
  • If "Minimum value" is selected, SMS starts at the point with the lowest elevation, and the elevations of its neighboring points are adjusted if necessary. SMS then continues to the point with the next lowest elevation.

The Smooth Dataset tool can help you resolve issues with raw data and help your model be more efficient. Try out the Smooth Dataset tool in SMS today!

Blog tags: 

How to Export Contour Lines as Shapefiles

Have you been wanting to export the contour lines in your GMS project as a shapefile so they can be opened in a different application? GMS allows exporting contour lines as a shapefile. Shapefiles are a file format used by many different GIS software applications. This post will explain how to export contour lines as shapefiles.

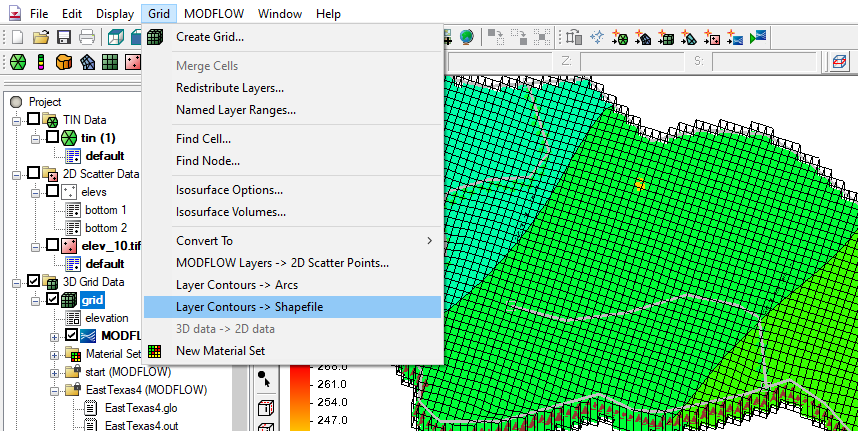
GMS contains the Layer Contours → Shapefile command to help save contour lines as a shapefile. Using this command requires your project to be set up correctly. Use the Layer Contours → Shapefile command by doing the following:

  1. Make sure the contours you want to convert to a shapefile are set to Linear in the Display Options. This can be accomplished by opening Display Options and clicking on Contours. In the Contour Method in the top left make certain in the dropdown that it is set to Linear.
  2. Make sure your Grid module is active in GMS, this can be done by clicking on the grid in Project Explorer or selecting the Grid module macro. The grid should be highlighted, meaning that it is now active.
  3. Go to the Grid menu and select the Layer Contours → Shapefile command. Use the dialog that appears to save your shapefile. Be sure to place it in the correct folder and name it properly. Otherwise you might lose the file.
  4. Now open your shapefile in the appropriate GIS software. The contour lines will appear as arc lines.
The Contour Lines to Shapefile Command

If you encounter issues with the shapefile, start with checking the folder where you saved the file. Make certain that all of the necessary files for the shapefile are there, including a projection file. Another item to check is that everything you want in the shapefile is displayed correctly in the Graphics Window before you export. Use the display options to adjust the contour lines if needed. Finally, there may be some differences between how GMS displays a shapefile and how other GIS applications display the shapefile. Opening the shapefile in GMS can help you determine if this is the case.

Try out converting contour lines to shapefiles in GMS today!

Blog tags: