Aquaveo & Water Resources Engineering News

Tips for Locating the Correct Projection

It is crucial that data brought into GMS, SMS, or WMS contain the correct coordinate system. The coordinate systems are designated through the use of projections. But what do you do if you import data and it doesn’t have the correct projection information or is missing projection information all together?

Example of The Display Projections dialog

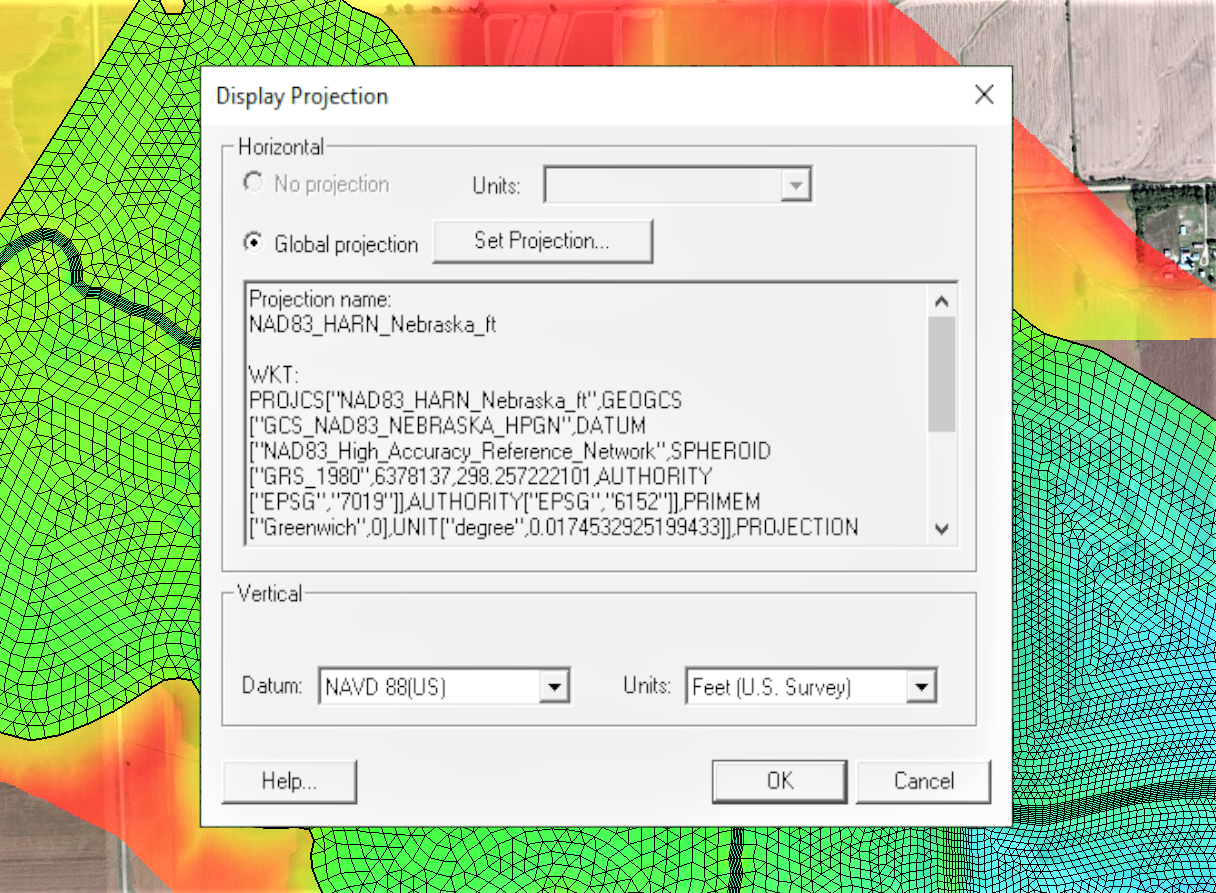
If you know what projection the data is supposed to be set to, use either the Display Projection dialog to set the projection for the project or right-click on the data in the Project Explorer to set the object projection. It is recommended that all data in a project use the same projection. To set the projection using the Projection dialog, do the following:

  1. Go to the Display menu at the top of the window and select Display Projection. This will bring up the Display Projection dialog.
  2. Under the Horizontal section, if “No projection” is selected, change it to “Global projection”. If “Global projection” is already selected and you want to change the projection, select the Set Projection… button.
  3. /From the dialog that opens, you can search through the provided database for the correct projection, or you can import a projection (*.prj) file from outside the application.

More information about the Display Projection dialog can be found here [2]. The object projection is set through the Project Explorer right-click menus, but otherwise follows a similar workflow.

If you already have data imported into the project that has the correct projection, see if you can reproject the data with the incorrect or missing projection. In general, you can reproject the data by right-clicking on a specific data object in the Project Explorer. With SMS, you can also go to the Display menu at the top of the window and select Reproject All… to reproject the data all at once.

If you don’t have a projection, use the Online Maps tool to locate the correct area in the world, then download the data using Online Maps to obtain coordinate data. Set your data to use this projection. Make certain the data lines up correctly with the downloaded data.

Rarely, the project information is included in the data but XMS fails to read the projection. This is often the result of a formatting issue. Try opening the file in a text editor to see what projection information is there. Then either adjust the formatting so XMS can read the projection information, or set the projection for the data after importing.

Head over to any of the XMS products and see how projections work today!

Blog tags: 

Using SRH-2D Initial Conditions

Are you wondering which initial hydraulic condition to use for your SRH-2D model in the Surface-water Modeling System (SMS)? Setting the initial condition for how each cell is to be treated in an SRH-2D simulation is an integral part of the model. This blog post will explore each of the five options for the initial conditions of a simulation that SMS provides. The settings for the initial conditions are found in the SRH-2D Model Control of the simulation on the General tab.

Example of SRH-2D initial conditions in SMS

The "Dry" initial condition is the default in SMS. This condition means that there is no water in any of the elements. This selection works well for almost any simulation and is recommended as a good option for the base of an SRH-2D project if you are not certain which condition will suit your project best. The dry condition is also commonly used to create a restart file, which will be covered later.

The "Automatic" condition begins the simulation with water at the outflow depth specified in the boundary condition coverage, which fills the domain. The outflow depth is assumed to be anything lower in elevation than the elements marked as containing backwater. Anything above the backwater elements are marked as dry. Dry and automatic are the best options to use to prepare a restart file condition.

The "Initial Water Surface Elevation" condition takes a water surface elevation dataset and applies one elevation value to all elements. If the starting elevation of an element is higher than the assigned water surface elevation, SMS automatically marks that element as dry. The Initial Water Surface Elevation condition is similar to Automatic in this way, but it can be useful if the water surface elevation value you want to use for your project is different from the elevation at the outflow boundary.

The "Water Surface Elevation Dataset" condition takes the values from a dataset at a single time step to determine the water surface elevation value for each element at the start of the simulation. Unlike the Initial Water Surface Elevation condition, the elevation value at each element will vary. In order to use a water surface elevation dataset condition, a simulation will need to have already been run.

The "Restart File" condition allows you to upload a file from a previous run that contains the initial conditions. This is a quick way to split a particularly long simulation into smaller chunks, which will cut down on run time. Each time SRH-2D runs with any of the initial conditions listed above, a restart file is written and saved to the data files folder outside of SMS. It should be noted that a restart file has to have been generated from a mesh that exactly matches the mesh in the simulation, otherwise it will not work. The slightest difference in the restart file mesh and the simulation mesh will generate an error during the model run.

When a restart file is used to denote the initial conditions, the hydraulic conditions that were computed during the run that created the restart file will always be applied starting at the very first time step in the simulation. More in depth information on the usage of a restart file in SRH-2D can be found in this blog post.

Head on over to SMS and explore the different ways these initial condition options can help you with your SRH-2D project today!

Blog tags: 

Utilizing PEST Observations with MODFLOW 6

MODFLOW 6 comes with an observation utility (OBS) in the Ground-water Modeling System (GMS). This allows you to calculate values like water levels, drawdown, and flow for specific locations throughout the simulation. This utility employs programs from PEST, which makes it similar to the observation feature available in GMS for MODFLOW-USG.

PEST was developed to be used in conjunction with complex environmental models. PEST is an inverse model that uses set parameters to launch the model multiple times until the output matches the observed values, eliminating the need for manual calibration of a MODFLOW simulation.

The way PEST Observations are added to MODFLOW 6 is different from how they are added to other versions of MODFLOW in GMS. With standard MODFLOW, observations are added to the simulation through the MODFLOW | Observations menu option. PEST observations are added to a MODFLOW 6 simulation by right-clicking on the simulation in the Project Explorer and selecting New Package | PEST Observations. This is where the PEST input data is generated for the simulation. The Generate PEST Observation Data button is what allows you to assign coverages as the head and flow observation coverages.

Example of PEST Observations for MODFLOW 6 in GMS

After running the simulation with PEST Observations, you can view the data using statistics tools, whisker plots, and observation plots. The statistics can be viewed in the form of a text file, which are found under the solution files folder in the Project Explorer. Running the MODFLOW 6 simulation with the PEST Observations package automatically generates new coverages with the observation arcs or points. The whisker and observation plots are accessed by making one of the new PEST observation coverages active, then selecting an observation point or arc in the Graphics Window.

If you right-click on one of the PEST Observation coverages you can select Observations, which will bring up a dialog that contains a table with all the data from the observation arcs or points, as well as a plot that displays all of the points on a graph.

Example of the Observation Plot dialog for MODFLOW 6 in GMS

Adding PEST Observations to your MODFLOW 6 model can be incredibly useful, so head over to GMS and see how it can enhance your project today!

Blog tags: 

Understanding Software Graphics Mode

You may have noticed that GMS, SMS, and WMS software (collectively known as XMS) executables in your Start Menu offer a "Software Graphics Mode" option.The software graphics mode was created to help troubleshoot certain issues that might arise when using XMS. This blog post will explore the reasons for using software graphics mode.

Example of the software graphics mode executable for SMS 13.3

The software graphics mode was specifically designed to address compatibility issues that may arise when there is a mismatch between the XMS software and the graphics card on your computer. While we aim to have XMS function smoothly on a variety of graphics cards, some cards may not be able to support the latest versions of XMS software.

When such a mismatch occurs, you may encounter difficulties while running the software. Some common issues that have been reported include:

  • Objects disappearing from the Graphics Window when attempting to draw new objects.
  • Complete disappearance of objects in the Graphics Window when changing views, even though they should remain visible.
  • Appearance of objects in the Graphics Window that cannot be hidden or removed.
  • Failure to successfully import specific graphics files.
  • In certain cases, the XMS application fails to start.
  • In other cases, the XMS application abruptly closes without warning.

To overcome these challenges, utilizing the software graphics mode allows the XMS application to bypass the graphics card, effectively acting as a "safe mode" for XMS. It's important to note that this places a heavier burden on your machine's memory and processor. But this mode typically enables the XMS application to function without the issues caused by the graphics card. To access the software graphics mode, simply navigate to your Start Menu and select the desired XMS executable that has "Software Graphics Mode" in its title.

If utilizing the software graphics mode successfully resolves the issue you were experiencing, there is an additional step to consider: updating your graphics card drivers.

Updating your graphics card drivers often proves to be an effective solution for resolving compatibility issues between the XMS application and your graphics card. Follow the standard procedure for updating the graphics card drivers on your operating system. In some cases, you may need to visit the website of your graphics card manufacturer to obtain the latest drivers.

Once you have updated your graphics card drivers, you can typically continue using the XMS application without relying on the software graphics mode.

We hope this information proves valuable in understanding the purpose of software graphics mode and troubleshooting any related issues. Should you have any further questions or concerns, feel free to contact us.

This article is an update for a previous version found here.

Blog tags: