Aquaveo & Water Resources Engineering News

Setting Up a Cross Section Animation in GMS

Have you ever wanted a way to better visualize cross sections in your project? The Animation Wizard in the Ground-water Modeling System (GMS) can help you do just that. Any project involving a 3D mesh or 3D grid can utilize the cross section animation feature.

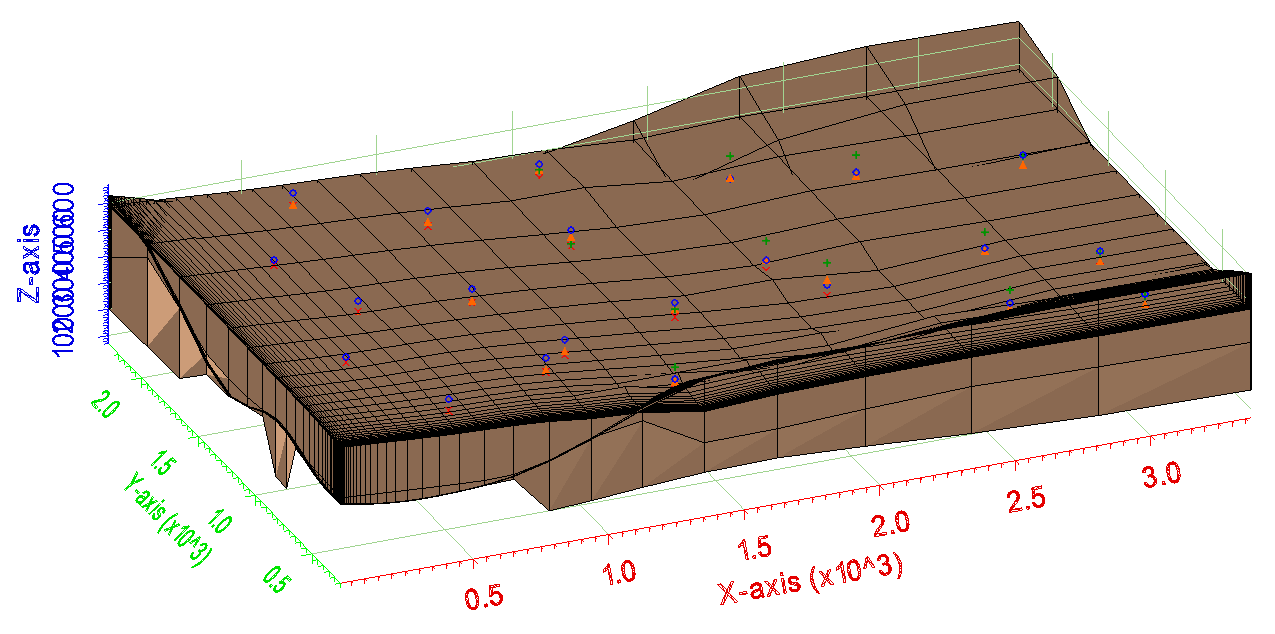
To build your initial cross section, you’ll need to start with a 3D mesh or grid as a foundation. After your foundation is set, build the cross section. Keep in mind that the Animation Wizard will create the animation through what is currently visible in the Graphics Window, so it is a good idea to get the display settings where you want them before starting the animation process.

Go to the Display menu and scroll down to the bottom to find the Animate option. Before initiating the animation, make sure that the cross section is active in the Graphics Window. Note that although the cross section needs to be active to create the animation, it doesn’t need to be turned on if you don’t want the static cross section from the project to be visible.

Example of the setting up a cross section animation in GMS

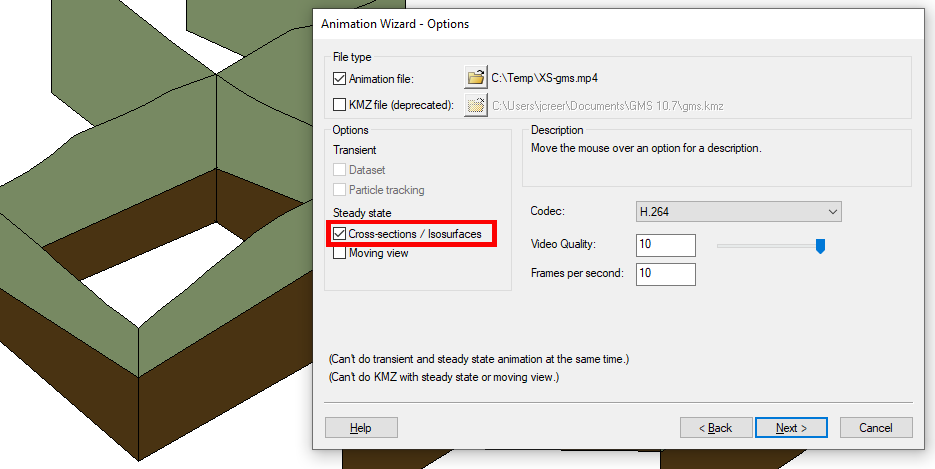
In the Animation Wizard dialog, turn on Cross-sections/Isosurfaces under Steady State. This is the option that animates the cross sections. You can change the speed of the animation by altering the number of frames per second, which is on the first page of the Animation Wizard, and the number of frames, which is on the second page. The lower the number of frames per second, the longer the animation will spend on each cross section, and vice versa.

The second page of the Animation Wizard is where you can specify the plane over which the cross sections will be animated. You can animate over the X, Y, or Z-axis, or any combination of the three. You can also alter more of the display options for the animation under the Cross Section Option button on this page.

After clicking Finish, the Animation Wizard will automatically export the cross section animation as an MP4 file, and you can open the MP4 file to view the finished product.

Even more settings and options are available that were not covered in this post, explore what cross section animations can do for your GMS project today!

Blog tags: 

Using the Blend Arcs Tool

Sometimes it may be useful to have a quick way to create an arc that lies between two other arcs. For example, you might need to quickly create a centerline arc between two bank arcs. The Surface-water Modeling System's Blend Arcs tool, which is new to SMS in version 13.2, means that creating a blended arc is only a few clicks away.

There are many applications for the Blended Arc tool in SMS. As mentioned earlier, it can be used to find the centerline of a channel using the bank arcs. It can also be used for a quick way to find the arc in the center of a bridge, culvert, or weir.There are many other potential applications for this tool.

Example of the Blend Arc command

The steps to use the blended arc feature are:

  1. Create two arcs. The arcs can be parallel to each other, or even touching.
  2. After selecting both arcs, right-click in the graphics window and choose Blend Arcs from the menu.

The blended arc is immediately generated. This can only be done with two arcs, however the two arcs you pick don't have to be right next to each other. You can still find the blended point of two arcs that are separated by other features, such as other individual arcs or polygons.

When working around polygons in your project, If a polygon has been created in the space where the blended arc will appear, when the Blend Arcs tool is used, the polygon will retain its original shape despite the fact that there is now an arc splitting it. This could be useful for your project, but if you intend for the new arc to split the polygon into two new shapes, you only need to click the Build Polygons macro one more time and the new polygons will be created with this new division.

Try the new Blend Arcs tool in SMS 13.2 today!

Blog tags: 

Engineering with Nature in SMS

Aquaveo has joined in the Engineering with Nature (EWN) initiative started by the U.S. Army Corps of Engineers by adding Engineering with Nature tools into the Surface-water Modeling System (SMS). EWN aims to move toward a more efficient, sustainable, and resilient approach to engineering by considering social, environmental, and economic impacts. To support the mission of EWN initiative, SMS has developed multiple tools. Let's look at some of these tools.

Adding engineering features into your project can sometimes be a long and tedious process. With the EWN Features tool in SMS you can streamline the process, reducing the amount of time that would have been spent inputting the necessary data before. The EWN Features tool is built especially for creating feature objects to represent structures in natural environments. To use the tool, create a new map coverage and select the EWN Features type in the Engineering with Nature folder under the list of Model types to begin building structures into your SMS project.

Once you have a EWN Features coverage, you can create polygons to model the feature. You then can assign attributes and properties to the polygon. Once you have the feature properties defined, you can use the tools in the coverage to insert the define feature into a 2D mesh or 2D unstructured grid (UGrid).

Example of the EWN Polygon Properties

Another EWN tool is the Sediment Volume Management tool. The Sediment Volume Management tool allows you to calculate cut and fill for sediment volume. Like the EWN Feature tool, this tool is accessed by creating a new map coverage with the Sediment Volume Transport type found in the Engineering with Nature folder under the list of Model Types. In the coverage you can create polygons and assigned sediment parameters. Then the sediment volume calculations can be performed using the tools in the coverage.

Additional EWN tools are in development for SMS. Look for them in future releases of SMS. In the meantime, try out using EWN in SMS today!

Blog tags: 

Using Bias When Creating a 3D Grid

Sometimes when creating a 3D grid in the Ground-water Modeling System (GMS) you may want to include a bias in the grid for your project. Using a bias parameter will refine part of the grid along a particular axis. Here are some important things to know when implementing a bias into the grid.

All of the data fields necessary for this function will be in the Create Finite Difference Grid dialog window, which appears when a new grid is created. It is here that you can customize the X, Y, and Z-Dimensions to include your bias. The starting point for the bias is determined by the cell number designated in the Origin field of each dimension, and the bias will run along the axis in the positive direction. You can input a different value for the bias in each of the dimensions.

Example of the Create Finite Difference Grid dialog showing the bias option

For a value greater than one in the bias field, each cell will be a percentage larger than the one previous. For example, a bias of 1.2 will mean that each cell following the origin is 20 percent larger than the one previous. These cells will grow in the positive direction along the axis. To make each cell following the origin smaller than the one previous rather than larger, make the bias less than one. For example, a bias of 0.8 will mean that each cell will be 80 percent of the size of the previous cell.

Example of bias used on a 3D grid

The length field in each of the dimensions determines the total length of the dimension. All of the cells on that axis will fit inside that measurement. After specifying a length, there are two options for how GMS will calculate the size of the cells including the bias. First is by the number of cells in each axis. The grid creator will calculate how big each of the cells must be in order to fit that number into the specified length.

The second option for determining cell size is to input a value for the dimension of the starting cell. For example, setting the cell size to 10 feet will tell the grid creator that the origin cell should be 10 feet, and each cell following should be a percentage larger than the origin cell until the entire length of the axis is filled. This can be refined even farther by specifying a cell size limit, keeping a cell from growing larger than a specified size. Because of this, the cell size limit should be set to a number larger than the base cell size.

With GMS, there are many ways to customize a 3D grid. Give the grid bias function in GMS a try today!

Blog tags: