Aquaveo & Water Resources Engineering News

Using Mesh Auto-Backup

Needing to save and reload older versions of your 2D mesh in the Surface-water Modeling System (SMS)? SMS 13.3 has a new set of tools that let you do just that. The Auto-Backup folder included in the Toolbox contains the Mesh Backup and the Mesh Reload tools. These tools let you save past versions of a 2D mesh while you are editing the mesh. If you discover a change to the mesh was undesirable, you can load a version of the mesh before the change was made.

SMS uses 2D meshes for a wide variety of models including, but not limited to, ADCIRC and SRH-2D, as well as generic models. Using the new Auto-Backup tools, you are free to make as many edits to the mesh as you need knowing you can recover the previous versions. This blog post reviews how the Auto-Backup tools work.

Mesh Backup Tool
The auto-backup tools

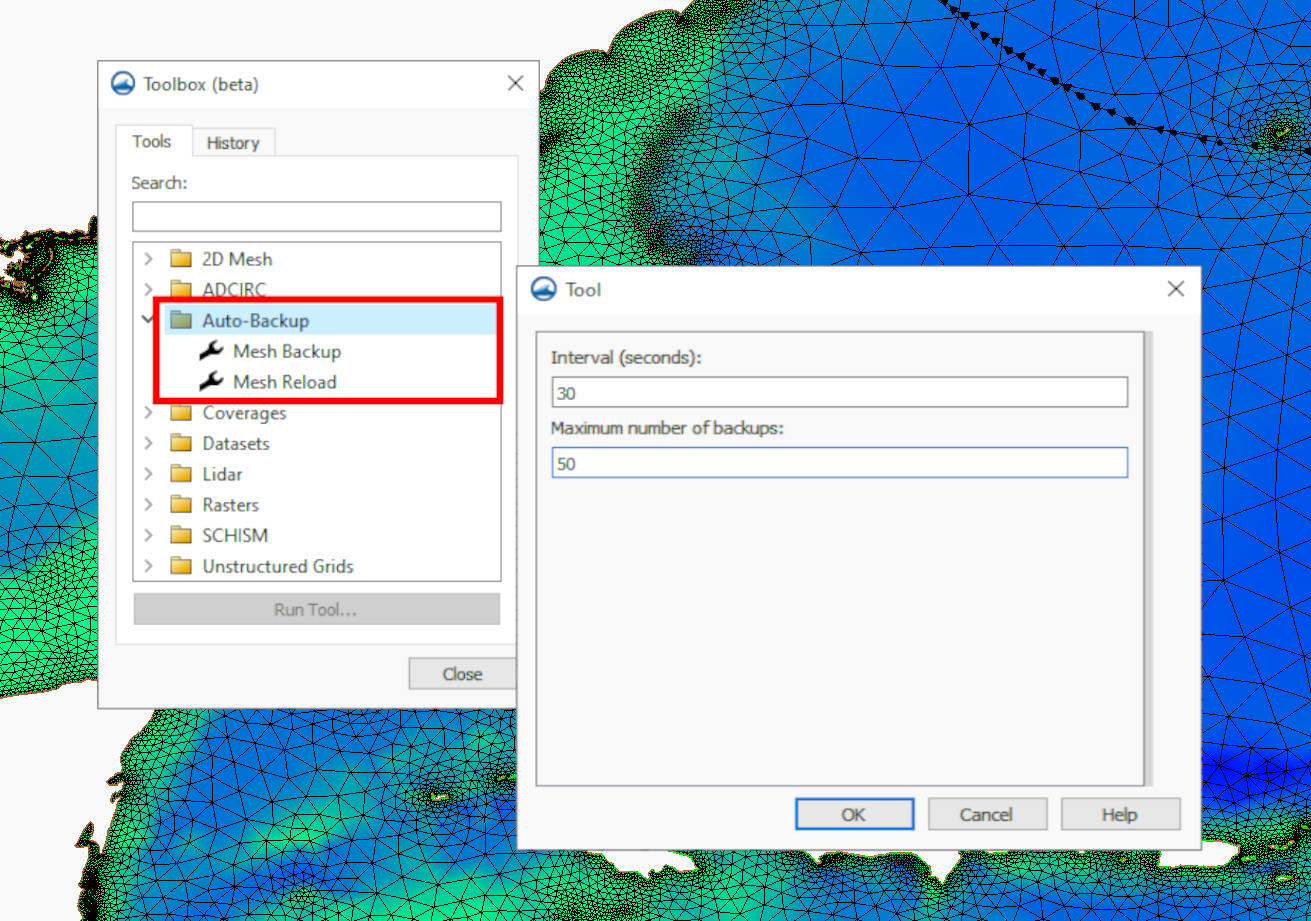
The Mesh Backup tool creates a series of backups at specified intervals for a specified number of iterations. Both the interval and the number of backups are determined by the user in the tool’s dialog. The default values are a mesh backup every 20 seconds, 10 times. These values can be changed to whatever works best for your project, however, it is recommended that you limit the amount of backups to roughly 200 or less.

When you run the tool, a dialog labeled Turn on/off auto mesh backup will appear. This dialog means that the tool is on, and will run in the background while you work on your mesh. This dialog is intended to stay open while you work on your mesh. Clicking Cancel will turn off the tool. While the tool is running, SMS checks to see whether or not a change has been made to the mesh every time the specified time interval has elapsed, and then creates a backup copy.

Running the mesh backup

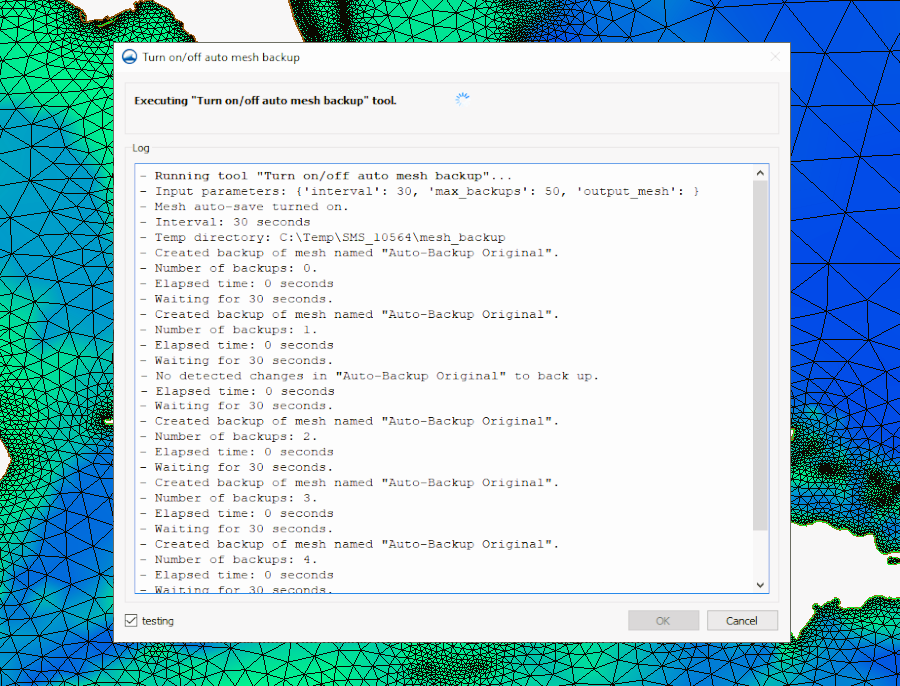
The log portion of the Turn on/off auto mesh backup dialog keeps track of how many backups have been made for the mesh. It will also tell you if there was an interval where no changes were made to the mesh. In cases where no changes were detected, a backup copy of the mesh during that period will not be stored.

Mesh Reload Tool

The Mesh Reload tool is where you can access the mesh backups. Naturally, this means that you have to run the Mesh Backup tool before anything will be available to reload. The Mesh Reload tool dialog contains a dropdown menu with all the backup meshes labeled by timestamp. The dropdown menu will often not contain every single time stamp, because there will likely be some time stamps where no changes to the mesh have been made.

Using the Mesh Reload tool does not erase the current mesh, or backtrack any changes that you’ve made. It will simply add a copy of what the mesh looked like at that time stamp under the "Mesh Data" folder in the Project Explorer. Try out the new Auto-Backup tools in SMS 13.3 today!

Blog tags: 

Solution for Overlapping Points in MODFLOW

When using the Groundwater Modeling System (GMS), it is important to understand how cells work in MODFLOW models, especially with conceptual models. Conceptual MODFLOW models are defined using feature objects such as points, arcs, and polygons on a grid. GMS processes each feature object separately, and occasionally there may be more than one feature object in a cell. MODFLOW is able to handle more than one boundary condition in a cell simultaneously, however, there are some things you should note.

The use of coordinates is essential to GMS as a whole, but not to MODFLOW. GMS uses coordinates to keep track of the exact location of feature objects relative to each other, as well as relative to the grid and other model data. Because the cell is the smallest unit of measurement in MODFLOW models, it only cares about the contents of the cell and not the specific location within it. All feature objects within the cell are mapped to the cell center and used for the cell calculations simultaneously.

When importing MODFLOW data that wasn't created in GMS, there are no coordinates tied to that data, so GMS uses the cell center as a reference and places all points there. This poses a problem as GMS requires that all points are assigned to unique coordinates, so GMS will generate an error message if any two or more points share an x, y, and z location. The way to fix this is pretty straightforward, although it can become tedious depending on the number of points on your grid. To solve this problem, follow these steps:

  1. Open the Attribute Table dialog by double-clicking on a point in the Graphics Window.
  2. Make sure the Feature type is set to "Points", and the Show dropdown is set to "All".
  3. Check the box next to Show coordinates.
Overlapping points in MODFLOW

Now you can identify which points share the same coordinates and make the necessary changes. GMS only cares if more than one point has exactly the same coordinates in the x, y, and z directions. Offsetting a point even slightly in one of the three directions is enough for GMS to no longer have a problem, and the calculations will come out the exact same as long as the point remains within the original cell.

Head over to GMS and use these tips to make sure your MODFLOW simulation runs smoothly!

Blog tags: 

How to Turn on Hydrographs for GSSHA Outlets

Are you needing to enable hydrographs in your GSSHA model in the Watershed Modeling System (WMS)? Hydrographs are a valuable tool included in WMS for understanding water dynamics in your model. In this blog post, we will learn about the process of enabling them within your GSSHA model.

The Gridded Surface Subsurface Hydrologic Analysis (GSSHA) model is a two-dimensional finite difference rainfall/runoff model. GSSHA uses a grid to establish the computational domain and parameters for surface runoff. The GSSHA model is fully coupled with hydraulic stream flow/routing models. After building a GSSHA model in WMS, you can create hydrographs to analyze the results.

Select a Sub-Basin Outlet Point within your GSSHA model, and identify one of the points where you want to monitor water flow and drainage closely. When using a GSSHA type coverage, the hydrographs can be turned on or off in the point attributes dialog. To access this dialog:

  1. Select one of the sub-basin outlet points, and right-click it and choose Attributes.
  2. In the Properties dialog that appears, turn on the checkbox labeled Hydrograph Output.
  3. Click out and this will turn on the hydrograph for that particular point.
  4. Next, re-run GSSHA. This is a crucial step because new GSSHA results will be needed to access the hydrograph.
Example of Hydrograph for GSSHA

After the new solution is loaded, you should see the hydrograph icon next to that point. From there, you can select and view it. Now, you can read the data and gain valuable insights into water flow dynamics at that location.

It is important to note that if you do not see the hydrograph icon then it is likely that WMS did not register you turning on the hydrograph option for the location. Check the properties for the model to see if the hydrograph output options were correctly saved.

Turning on Hydrographs for different outlets is one of the many options you can use with GSSHA in WMS. Try out turning on Hydrographs for different outlets and other options for GSSHA in WMS today!

Blog tags: 

Using the Hydraulic Toolbox with SMS

You may have already used the Hydraulic Toolbox to define a culvert for an SRH-2D model, but did you know its suite of calculators can assist you in many ways when creating a simulation in the Surface-water Modeling System (SMS)? The Hydraulic Toolbox is a software developed for the FHWA by Aquaveo, and there are many uses for the calculators, but today we’ll go over one example today to give you an idea of what you can do.

The Hydraulic Toolbox can assist you with calculations for other simulations, such as an SHR-2D urban hydraulics project in SMS. One of the main calculators that can be used for urban modeling with SRH-2D is the Curb and Gutter flow analysis.This calculator examines flow across storm drain inlets for various curb and gutter openings.

Example of the Hydraulic Toolbox with SMS

The Hydraulic Toolbox includes a macro that opens the Curb and Gutter Analysis calculator, or you can access it through the Calculators menu at the top of the window. This adds it to the Project Explorer under a “Project” folder. Once it has been added to the Project Explorer, double-click on the tool to open the calculator’s dialog. There are three main parts to the calculator: Gutter, Inlet, and a Parameters table. The Gutter section contains values for the gutter dimensions. This includes, but is not limited to, the gutter width, design flow, width of spread, etc.. The Inlet section is where factors defining the inlet location, inlet type, grate type, etc. are included. The Parameters table displays all the inlet data after it has been calculated by using the “Compute Inlet Data” button.

The Hydraulic Toolbox is separate from SMS, so as of SMS 13.3, data from the calculator will need to be entered manually into the relevant portions of SMS. The calculated data can easily be viewed from the calculator dialog itself, or you can export a document that contains a list of all of the data from the calculator. The Create Report function can be performed by right-clicking on the project folder in the Project Explorer, clicking the “Create Report” macro, or finding the Create Report option under the Calculators menu.

You can also attach notes to the project in the Hydraulic Toolbox. The options that allow you to create notes are found in the same three locations as the Create Report function, detailed above.

More in depth information about how the Curb and Gutter calculator, as well as the Hydraulic Toolbox in general, works can be found in the User’s Manual, which is accessed through the Help menu in the Hydraulic Toolbox. The Hydraulic Toolbox can be downloaded from this link.

The Curb and Gutter analysis calculator is just one example of how you can use the Hydraulic Toolbox with SMS. Head over to SMS and the Hydraulic Toolbox to explore the variety of calculators and how they can help you with your project today!

Blog tags: 

How to Refine an Unstructured Grid

When working with a multi-layer unstructured grid (UGrid) in the Ground-water Modeling System (GMS), your project may require different levels of refinement in each layer to introduce complexity to the stratigraphy. GMS currently offers a limited number of ways to achieve this in a 3D UGrid module. Mapping coverage directly to a 3D grid simplifies vertical refinement considerably, but it results in all layers being of uniform size. This blog post will cover the most straightforward way to create a complex stratigraphy, as well as some things that may be useful to know about how refining grids works and what the limitations are.

The type of grid that will often get you the closest to where you want to be is a Quadtree grid. These are the steps you’ll want to follow:

Using the Refine command to refine a quadtree
  1. Use the TINs/Horizons to UGrid approach to generate a grid that incorporates the desired pinchouts and ensures an appropriate level of refinement for the least refined layer.
  2. Right-click on the Quadtree UGrid in the Project Explorer and scroll to the bottom of the UGrid Properties dialog window.
  3. Make sure the Constraint dropdown is set to "None". If the constraint is set to "3D", you will not be able to refine the UGrid cells.
  4. Note that you can’t change the constraint back to "3D" after changing to "None", so you may want to duplicate the UGrid and make changes to that one to preserve the original.
  5. In the toolbar above the Graphics Window, check the box for Single Layer to isolate a layer of the grid for refinement. Highlight the cells you wish to refine using the Select Cells tool.
  6. Right-click on the selected cells and choose Refine.

The newly generated UGrid maintains the original level of refinement on all layers except for the one where you just refined some of the cells. You can repeat this process as many times as needed to achieve the desired level of refinement.

Currently, there is no automated process for this kind of complex refinement, so while it is possible to use this process on a larger project, it may not be practical. If you have a limited number of areas to work on, this workflow lets you produce a grid that features your desired TIN pinchouts, with varying levels of refinement for different layers. It is also not possible to un-refine a grid, so you’ll always need to start with the least refined layer and work your way to the most refined.

Head over to GMS and try this method to refine your 3D grid today!

Blog tags: