WMS

Discover MODRAT Percent Impervious

When working with the Watershed Modeling System (WMS) and the MODRAT model, one potential aspect of your watershed analysis would be determining the percent impervious values for each sub-basin. Accurate percent impervious calculations may significantly influence your hydrologic modeling outcomes. Here is a guide to help you navigate this process effectively.

Importing Land Use Data

To compute the percent impervious for each sub-basin in MODRAT, you need to start with accurate land use data. Land use data in WMS is typically stored in the GIS and Map modules. The most efficient way to read this data into WMS is through a shapefile. Here’s how you can do it:

Example of the Map MODRAT Attributes dialog
  1. Create a Land Use Coverage: In WMS, start by creating a new land use map coverage. This coverage will hold all the land use data you import.
  2. Import the Polygon File: Import your land use polygon shapefile into WMS. This file should contain various land use types and their respective boundaries.
  3. Assign the Percent Impervious Field: Ensure that the percent impervious field, often labeled as IMPERV_ by the Los Angeles County Department of Public Works (LACDPW), is correctly mapped to the LA County Soil land use field in WMS. This step is crucial as it links the impervious data to your land use coverage.
  4. Compute and Assign Percent Impervious: With the land use data now present in WMS, use the "Map Attributes" command in the MODRAT menu to compute and assign the percent impervious values. This function will analyze the land use data and calculate the percent impervious for each sub-basin.
Using Coverage Overlay Options

Another method to determine the percent impervious values is by using the Coverage Overlay options in WMS. This approach is similar to calculating curve numbers and involves overlaying land use coverage with drainage coverage.

  1. Overlay Land Use and Drainage Coverage: Start by overlaying your land use coverage with an existing drainage coverage. This will combine the datasets, allowing for an analysis of land use types within each drainage area.
  2. Calculate Percentages: The overlay will provide you with the percentages of different land use types within each sub-basin.

Whether you choose to import land use data directly or use the coverage overlay options, both methods can aid in determining the percent impervious. Use either method in your MODRAT projects in WMS today!

Blog tags: 

Managing File Paths in WMS

When working in the Watershed Modeling System (WMS) the software refers to multiple applications and files in order to operate correctly. The default settings for accessing these files should generally be followed. However, there are times when these file paths need to be altered by you or the paths get changed unintentionally. This post will go over some of the important file paths to pay attention to in WMS.

Typically, WMS will be installed on your C drive or whichever drive you specify on your local machine. When WMS is installed, it will also install multiple other applications that it uses. These are most often the numerical models that WMS uses along with some drivers. WMS will keep everything contained to where it can find these applications.

However, to give you more flexibility, WMS allows you to change the location of these applications. Most path locations can be changed in the Preferences dialog. The Files tab of the Preferences dialog contains the file paths for the numerical models and other applications. The file paths can be changed here to direct to a different location. This can be useful when you are needing to use a different version of a model executable other than the one that comes installed with your version of WMS.

File paths set in WMS

The Preferences dialog also allows you to change the file path for the Temp directory. This is done on the General tab.

It should be noted that WMS retains these file paths once they have been set. Therefore, when you are moving files around, pay attention that WMS will not automatically update to the new location. When a model executable gets moved to another directory, you will need to manually update the file path in WMS in order to avoid potential errors.

The Files tab of the Preferences dialog is also useful for locating specific model executables and files that you suspect may need to be updated. This can help you troubleshoot model executable issues that occur during a model run.

Now that you know more about how WMS manages file paths, make use of them in your WMS projects today!

Blog tags: 

Defining Elevation and Storage Capacity of Detention Basins

Did you know that the Watershed Modeling System (WMS) has a calculator that can define the relationship between the elevation and storage capacity of a detention basin? This is a useful tool for any WMS project with detention basins. The detention basins calculator is a simple tool that can quickly get the storage calculations you need for your model.

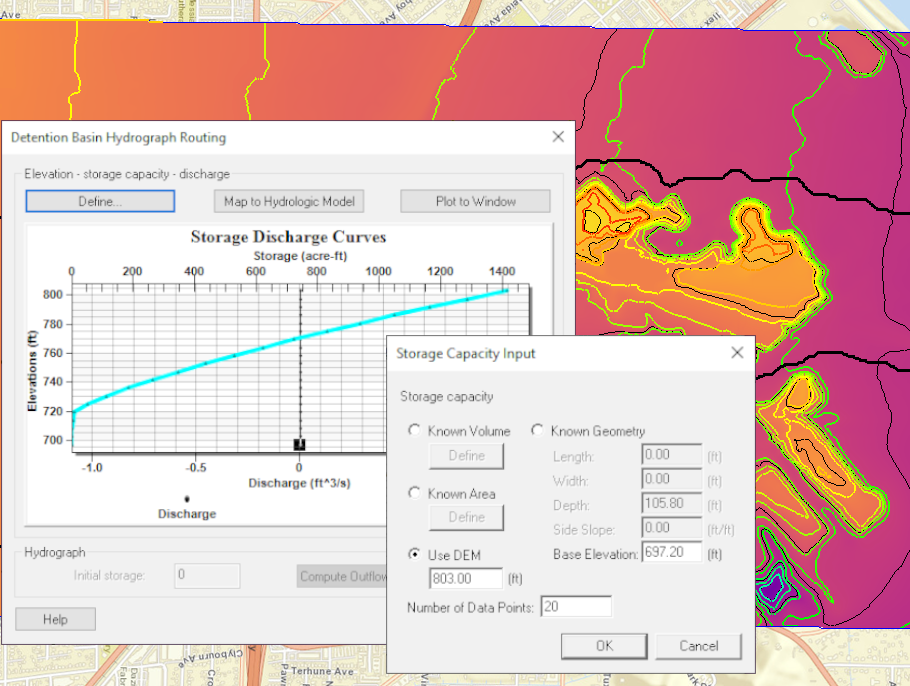
WMS uses the Hydraulic Toolbox to perform these calculations for the detention basin calculator. To open the detention basin calculator, first you need to make the Hydrologic Modeling Module active and select an outlet. Detention basins… is one of the options under the Calculator menu. After selecting Detention basins… a dialog named Detention Basin Hydrograph Routing will appear. Clicking the Define… button opens the Storage Capacity Input dialog, which is where you can enter the data that is needed for the calculations.

Basin Calculator in WMS

There are four data input options you can use to calculate storage capacity in the Storage Capacity Input dialog. Only one of the four input options is needed in order to perform the calculations. Which one you use will depend on what data is readily available for your model.

It is important to note that regardless of what measurement the general display projection is set to, the detention basin calculator will measure the elevation in feet and the storage volume in acres per foot.

After you exit the Storage Capacity Input dialog, a plot will be automatically generated in the Detention Basin hydrograph Routing dialog. This plot displays the relationship between the elevation and the amount of storage, as well as discharge if there is any. This plot functions the same way as any other plot window in WMS. You can learn more about plot windows by following this link to our wiki.

Head over to WMS to check out the detention basin calculator and see how you can use it to calculate the storage versus elevation for your detention basins today!

Blog tags: 

How to Turn on Hydrographs for GSSHA Outlets

Are you needing to enable hydrographs in your GSSHA model in the Watershed Modeling System (WMS)? Hydrographs are a valuable tool included in WMS for understanding water dynamics in your model. In this blog post, we will learn about the process of enabling them within your GSSHA model.

The Gridded Surface Subsurface Hydrologic Analysis (GSSHA) model is a two-dimensional finite difference rainfall/runoff model. GSSHA uses a grid to establish the computational domain and parameters for surface runoff. The GSSHA model is fully coupled with hydraulic stream flow/routing models. After building a GSSHA model in WMS, you can create hydrographs to analyze the results.

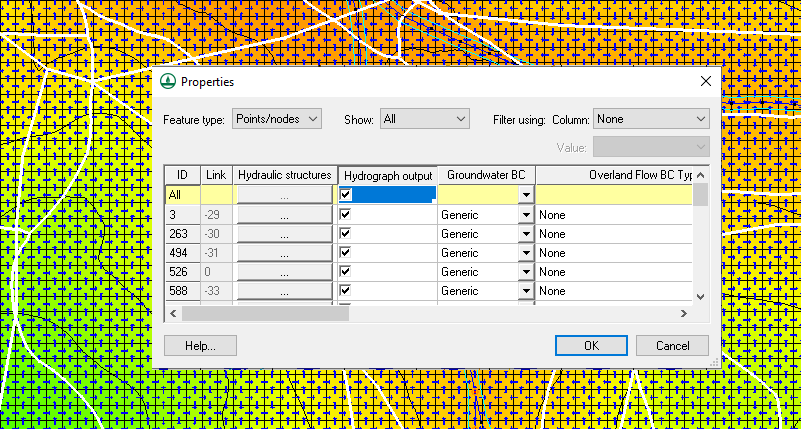
Select a Sub-Basin Outlet Point within your GSSHA model, and identify one of the points where you want to monitor water flow and drainage closely. When using a GSSHA type coverage, the hydrographs can be turned on or off in the point attributes dialog. To access this dialog:

  1. Select one of the sub-basin outlet points, and right-click it and choose Attributes.
  2. In the Properties dialog that appears, turn on the checkbox labeled Hydrograph Output.
  3. Click out and this will turn on the hydrograph for that particular point.
  4. Next, re-run GSSHA. This is a crucial step because new GSSHA results will be needed to access the hydrograph.
Example of Hydrograph for GSSHA

After the new solution is loaded, you should see the hydrograph icon next to that point. From there, you can select and view it. Now, you can read the data and gain valuable insights into water flow dynamics at that location.

It is important to note that if you do not see the hydrograph icon then it is likely that WMS did not register you turning on the hydrograph option for the location. Check the properties for the model to see if the hydrograph output options were correctly saved.

Turning on Hydrographs for different outlets is one of the many options you can use with GSSHA in WMS. Try out turning on Hydrographs for different outlets and other options for GSSHA in WMS today!

Blog tags: 

Pages