WMS

Viewing Multiple GSSHA Scenarios in a Hydrograph

Have you needed to compare multiple GSSHA scenarios using a single hydrograph? New functionality has been added to WMS that now allows for hydrographs that can display results from multiple GSSHA scenarios. This post will review how multiple GSSHA scenarios can be added to hydrographs, a feature newly introduced in WMS 11.1.

Hydrograph showing multiple GSSHA scenarios

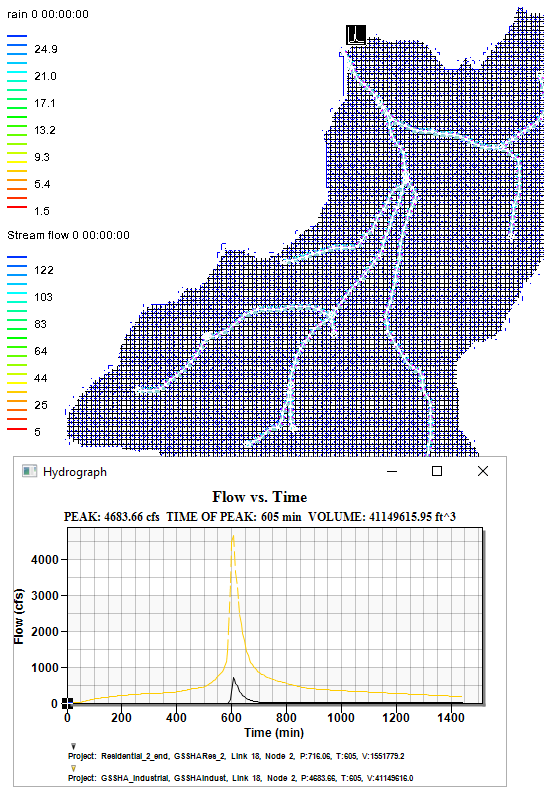
Hydrographs that show multiple GSSHA scenarios plot them all out within the same hydrograph. A legend below the graph will indicate which GSSHA scenario run is which in the hydrograph, as each run should be in a different color and potentially a different line style. The dimensions of the hydrograph will be such that all of the different runs will all be able to be displayed.

To be able to work with hydrographs that show multiple GSSHA scenarios, multiple GSSHA scenarios will need to be loaded into WMS to be compared with each other. This can be done by loading multiple GSSHA projects that use the same area into WMS. These can be saved together as a single GSSHA Group Project (GGP) file if needed.

When these GSSHA scenarios will be run, rather than using the typical Run GSSHA command, instead go to the GSSHA | Run GSSHA Group Command. This will open up the Save and Run GSSHA Group dialog. Here, the projects that will run can be selected, as well as the group filename. When the projects have been selected, clicking OK will close out the dialog and bring up the Model Wrapper dialog. This will be brought up for every scenario that will be run, along with the necessary loading of the data into WMS. This will likely take some time, depending on the nature of the GSSHA scenarios, the amount of data to be loaded in, and the amount of different scenarios that will all need to be run.

Once the entire group of GSSHA scenarios has been run, selecting the hydrograph for viewing should display plots of all of the relevant hydrograph scenarios that have been run. Feel free to examine the data, and potentially experiment with different combinations of geographically related runs.

Try out multiple scenario hydrographs in WMS 11.1 today!

Blog tags: 

How to Troubleshoot Graphics Card Issues and Display Issues

Out of all the potential issues that can come up, display issues can be some of the most annoying. Display issues can come from individualized hardware configurations, display settings, operating system and software versions which makes solving these issues not as simple as a one-size-fits-all approach. This post will review general best practices for troubleshooting these kinds of issues with your graphics card or display.

Some of the most common display issues that can arise with XMS are problems with one or more of the following:

  • Transparency
  • Functional surface
  • Texture mapping
  • Film loops
  • Contours

The causes behind display issues can be divided into the following categories:

  1. Issue related to remote desktop or virtual machine
  2. Integrated graphics used instead of discrete graphics
  3. Bug in graphics drivers
  4. Limitation of integrated graphics
  5. Bug in XMS affecting all hardware configurations
  6. Bug in XMS affecting specific hardware configurations

Since hardware configurations vary and operating systems change over time, the information here is a general workflow used for troubleshooting.

  1. Remote and Virtual Machine issues: Check if XMS is being run locally or if a virtual machine/remote desktop is being used to rule out Category A.
  2. Versioning: Go to Help | About to note the XMS version, build date, and graphics library used.
  3. Try to rule out Categories E and F: Run XMS in Software Graphics Mode. If the issue is resolved in Software Graphics Mode, then the issue is related to Categories B - D.
  4. Try to rule out Category B: Go to the Device Manager for the Display Adapter. If the driver information/version for the discrete graphics matches what is shown in Help | About, then XMS is using discrete graphics. If not, go to Step 6 to ensure XMS is using discrete graphics.
  5. Device manager
  6. Update graphics drivers: Whether or not the system has discrete graphics, updating the graphics driver will solve some display problems. If the machine already has nVidia or AMD software installed, drivers can be updated through those programs. Otherwise, click the “Update Driver” button (shown in the dialog in Step 4) or Google “GraphicsCard Driver Download” using the graphics card model you have in place of GraphicsCard. Exercise caution with the links you click on. Be sure to click on official AMD, nVidia, or computer manufacturer websites. Avoid 3rd party utilities that offer to optimize your system or install adware/spyware.
  7. Set system to use discrete graphics: Change settings to ensure XMS always utilizes discrete graphics. Many systems, especially laptops, default to power saving modes where programs utilize integrated graphics even if the machine has discrete graphics. The way to change these settings varies by machine.
  8. Reporting Bugs: If Categories A - D have been ruled out, determine if the issue is machine-specific. If reproducible, report to tech support.

If you continue to experience display issues, contact Aquaveo's technical support team.

Blog tags: 

Converting a Lidar File to a DEM in WMS

Do you have a lidar file that you would like to convert into a DEM file? WMS can help you with this. Lidar files can contain a large amount of 3D points used for representing features on the Earth’s surface. DEMs can be derived from high-resolution LIDAR data, and we have developed a workflow that can do this. This post will review how to convert LIDAR files to DEM files quickly and easily in WMS.

This can be done by using the following workflow:

  1. Use any of the methods to open files to import your lidar files into your WMS project.
  2. If you have more than one lidar file imported into the GIS module, select all of the separate files and then right-click one of them and select Merge… to open the Lidar File dialog where you can name and save your merged lidar file.
  3. After you have imported your lidar file, right-click it in the Project Explorer and select Interpolate to | Raster… to open the Interpolate Lidar to Raster dialog.
  4. Review the settings and click OK when they are all set correctly.
  5. Converting Lidar to Raster
  6. In the Raster File dialog, set the name and type for the raster file and then click Save to close the dialog and save the raster file.
  7. When done generating the raster and updating the display, right-click the new raster file in the GIS module and select Convert to | DEM to open the Resample and Export Raster dialog.
  8. Review the settings and click OK when they are all set correctly.
  9. You should now have a DEM file of the same area as your lidar files. Hide everything in the GIS module to view the DEM file on its own.

It should be noted that if you have multiple lidar files, you can convert each file individually rather than merging them all together as was done in Step 2. The merge makes the final product easier and quicker to accomplish.

Try out converting lidar files to DEMs in WMS today!

Blog tags: 

New Features to Check Out in WMS 11.1

Aquaveo is pleased to announce the release of the Watershed Modeling System 11.1 Beta! With this release, WMS contains changes and improvements to some of the features. If you have already downloaded WMS 11.1 beta, you might have already noticed some of the changes. We'd like to highlight a sampling of some of the new functionality you can expect to find in WMS 11.1.

GIS Module

A lot of the GIS module functionality has been made to perform faster. This includes performing GIS parameter computations directly from shapefiles, performing shapefile to feature object conversion, and displaying large raster files. Also added the GIS module, through the new Online Maps feature, there has been an addition of Web-based Google tile map services that can be displayed as background maps. Improvements have also been made to the list of many potential online sources that can be used as data sources for the online maps. There have also been changes to the display and operations on images and raster files of various types.

Raster of West Virginia
GSSHA

The capabilities of GSSHA model implementation have been expanded within this new release. These include the ability to view multiple scenario hydrographs in a GSSHA solution and the added capability to run calibration on Richard's Equation parameters within GSSHA.

Map Data Module

More options have also been extended when it comes to the Map Data module. A new Extract Features tool allows users to directly convert raster data to stream and ridge/embankment centerlines. In addition to new tools, the Map flood tool has added an option to use local shapefiles that can be used when web service data are not available, where those shapefiles can be used for Base Flood Elevations and floodplain boundary polygons.

These are just a few of the new features in the WMS 11.1 Beta. Try out these features and more by downloading the WMS 11.1 Beta today!

Blog tags: 

Pages