Aquaveo & Water Resources Engineering News

Using Pre-Generated Polygons to Delineate a Basin

Delineating an accurate basin is an important part of a watershed project. WMS provides a number of tools for delineating a watershed basin. The Hydrologic Modeling Wizard is often used to step through the entire process of delineating a basin.

However, it is possible to delineate a basin using data from outside of the Hydrologic Modeling Wizard. In particular, the Drainage module contains tools for delineating a basin using existing project data.

For example, if you have a shapefile with polygons that gives the general outline of the basin, that shapefile can be used to delineate the basin. To use the shapefile polygons to delineate the basin, do the following:

  1. Import the shapefile into WMS. Verify the location is correct.
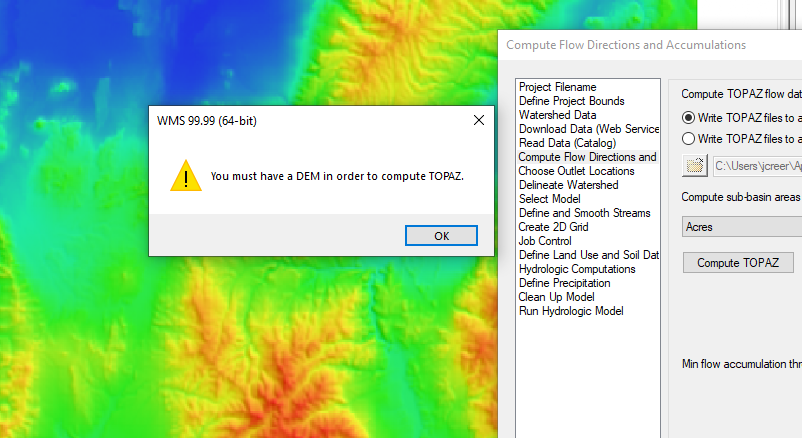
  2. If you have not already done so, add a DEM for the area of interest to the project.
  3. Generate the flow direction and accumulation, either by running TOPAZ/TauDEM or by importing it.
  4. Map the shapefile polygon(s) into feature polygons in a drainage type coverage.
  5. Place your outlet point(s) and digitize the streams. You can either manually draw the arcs, or load the streams from a shapefile. Be sure to verify that the arcs are set to Stream (not Generic) and that the directions are flowing from upstream to downstream (see "Stream Arrows" in the Drainage Display Options).
  6. Select DEM | Polygon Basin IDs -> DEM in the Drainage module.
  7. Select DEM | Compute Basin Data in the Drainage module.
Basin delineated from shapefile

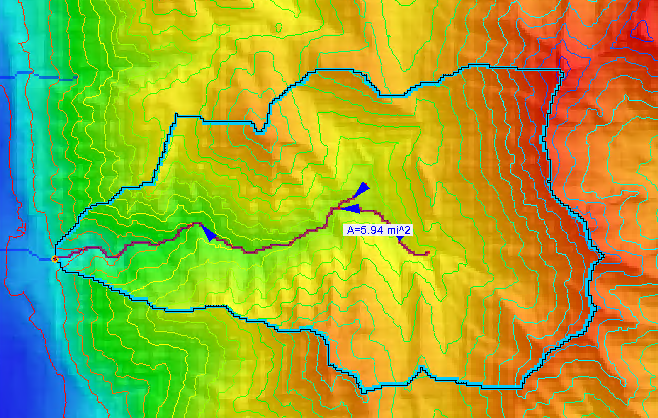
Once you have a delineated basin, you can use the basin with the watershed modeling model of your choice. Be certain to review the basin to make certain it contains all of the area you need for your project.

WMS provides a large amount of flexibility in delineating a watershed basin in order to adapt to the needs of your project. Try out the different basin delineation tools in WMS today!

Blog tags: 

Viewing Vectors on the Watersurface

With the release of SMS 13.1 beta, a new option has been added to the Vector tab. The existing Vector tab in the Display Options dialog allows viewing vector data as arrows as data points in your project. SMS can change the density of how the vector arrows are displayed and to display the vector arrows along a constant elevation. This new option allows you to display the model vectors relative to a selected dataset.

To use this option:

  1. Open the Display Options, turn on vectors, and go to the Vector tab.
  2. On the Vector tab and change the Origin to be "Relative to dataset".
  3. Select the Dataset button under the Origin to bring a tree item selector dialog.
  4. Select the Dataset you want to use.

After closing out the Display Options dialog, you will be able to see the vectors relative to the selected dataset. For example, if you use a water surface elevation dataset, you would be able to see the vectors relative to the water surface elevation.

Vectors relative to the water surface elevation

This option is available for all modules that allow displaying vectors. This includes the 2D mesh module, Cartesian grid module, quadtree module, and scatter set module.

There is also an option to specify an offset for the selected dataset. For example, you could set the offset to 1 or 2 to get the vectors slightly above the surface. The result would show the vectors mapped 1 or 2 feet above the ground elevation.

Vectors offset from ground elevation

This addition to the vector display option can be used with any dataset in the same module. Therefore, any dataset in the mesh module can be used with a mesh, any dataset in the scatter module can be used with a scatter set, etc.

Try out using the new "Relative to dataset" vector display option in the SMS 13.1 beta today!

Blog tags: 

Using the CLN Package to Model Faults and Fractures

Needing to model features or faults in your MODFLOW-USG model? The CLN Package is used in conjunction with MODFLOW-USG to model features that are significantly smaller than the individual cells in a 3D groundwater flow model. This tool allows you to model one-dimensional linear features within a three-dimensional simulation domain when the flow connections are separate from those of the aquifer. This makes it ideal for modeling fractures and faults.

CLN network map

There are a number of requirements to use the CLN package:

  1. The MODFLOW version must be set to MODFLOW-USG in the MODFLOW Global/Basic Package dialog.
  2. There must be a coverage with Wells and Wells (CLN) turned on in the Coverage Setup dialog.
  3. The coverage must have a default layer range of at least two layers, and it must be active on the layers where the CLN features will be.

The CLN package works with unstructured and 3D grids. It allows connections to be set up between the CLN cells to regular groundwater cells. You can connect a CLN cell to one or more groundwater flow cell, and CLN cells do not have to be ordered upstream to downstream. These features allow you to scale the conceptualization of the flow as needed.

For example, a single cylindrical CLN cell (representing a long fracture or fault within the ground) connected to multiple groundwater flow cells may be pumped to simulate multi-node well connections. The CLN cell extracts water from the groundwater flow cells as part of the solution to the coupled CLN and groundwater flow equations.

You can treat a CLN cell as a well by using the WEL Package to assign a source or sink to the cell. This can also be done using multiple CLN cells. Multiple fractures can be connected together to form one larger network. To make things easier, you can also use shapefiles to map the features of the CLN cells and connections.

CLN network map examples

By using this method, you can create a more complete picture of the domain you are modeling. Try using the CLN package to model faults and features in GMS today!

Blog tags: 

Troubleshooting TOPAZ and TauDEM in WMS

Both TOPAZ and TauDEM make computing flow directions and accumulations for basin delineation easier. One of these two programs is typically used during the process of delineating a watershed. During this process, it is not unusual to run into some issues. Below are some common issues and how to resolve them.

Missing DEM

DEM data is required to run TOPAZ or TauDEM. A DEM can be imported from a file or downloaded from a web service. If you get an error stating that no DEM exists after you have imported the DEM data, this is typically because the DEM was not imported correctly.

TOPAZ unable to find DEM

Often, the DEM has been imported as a raster file and is in the GIS data module. In order for TOPAZ or TauDEM to use this as a DEM it will need to be converted from a raster to a DEM using the Convert to | DEM right-click command in the GIS module.

Not Enough Data

In order for TOPAZ or TauDEM to work properly, a DEM is needed that has enough data to work with. When working on modeling very small areas, TOPAZ or TauDEM may fail to execute correctly because there is not enough data available to complete the process.

In order to fix this issue, it is recommended that you slightly expand the size of the area you are modeling. In particular, the resolution of the DEM being used may need to be increased. Use your best judgement as to how much additional data to add.

Too Much Data

The opposite of having too little data would be to have too much data which causes TOPAZ or TauDEM to slow down or stop running altogether. This typically happens when attempting to model a very large watershed. In this case, the issue typically isn’t related to problems with TOPAZ or TauDEM but is more likely related to the available processing power of the computer being used.

With many projects that have too much data, often much of that data is unnecessary. Often a lower resolution DEM can be used. When modeling a large watershed area, you should use your engineering judgement to find areas of greatest interest and then focus on those areas. If that is not possible, then you will need to find a way to increase your computer's processing power.

TOPAZ and TauDEM tools for delineating a basin. Try them out in WMS today!

Blog tags: