Taking Advantage of the SRH-2D Channel Calculator
By aquaveo on May 14, 2024The Surface-water Modeling System (SMS) provides a useful tool that generates an estimated water surface elevation on an "Exit-H" boundary condition in an SRH-2D model. The Channel Calculator in SMS makes it easier to calculate water surface elevation values. It also gives you greater control of over the parameters
When building an SRH-2D model, the exit boundary will need to be defined. A constant elevation is often used, but this can not be sufficient in many cases. The Exit-H boundary condition is a stage type exit boundary where water surface elevation may be given as a constant number or as a stage-discharge or rating curve. The Channel Calculator is used to compute and assign a normal or critical water surface elevation for the outflow boundary condition. It also gives you greater control over the parameters used to determine the outflow conditions.
The Channel Calculator is accessed through the SRH2D Assign BC dialog. The Populate using Channel Calculator button appears at the bottom of the dialog when "Exit-H (subcritical outflow)" is selected as the BC Type and the Water Surface Elevation option has been determined.
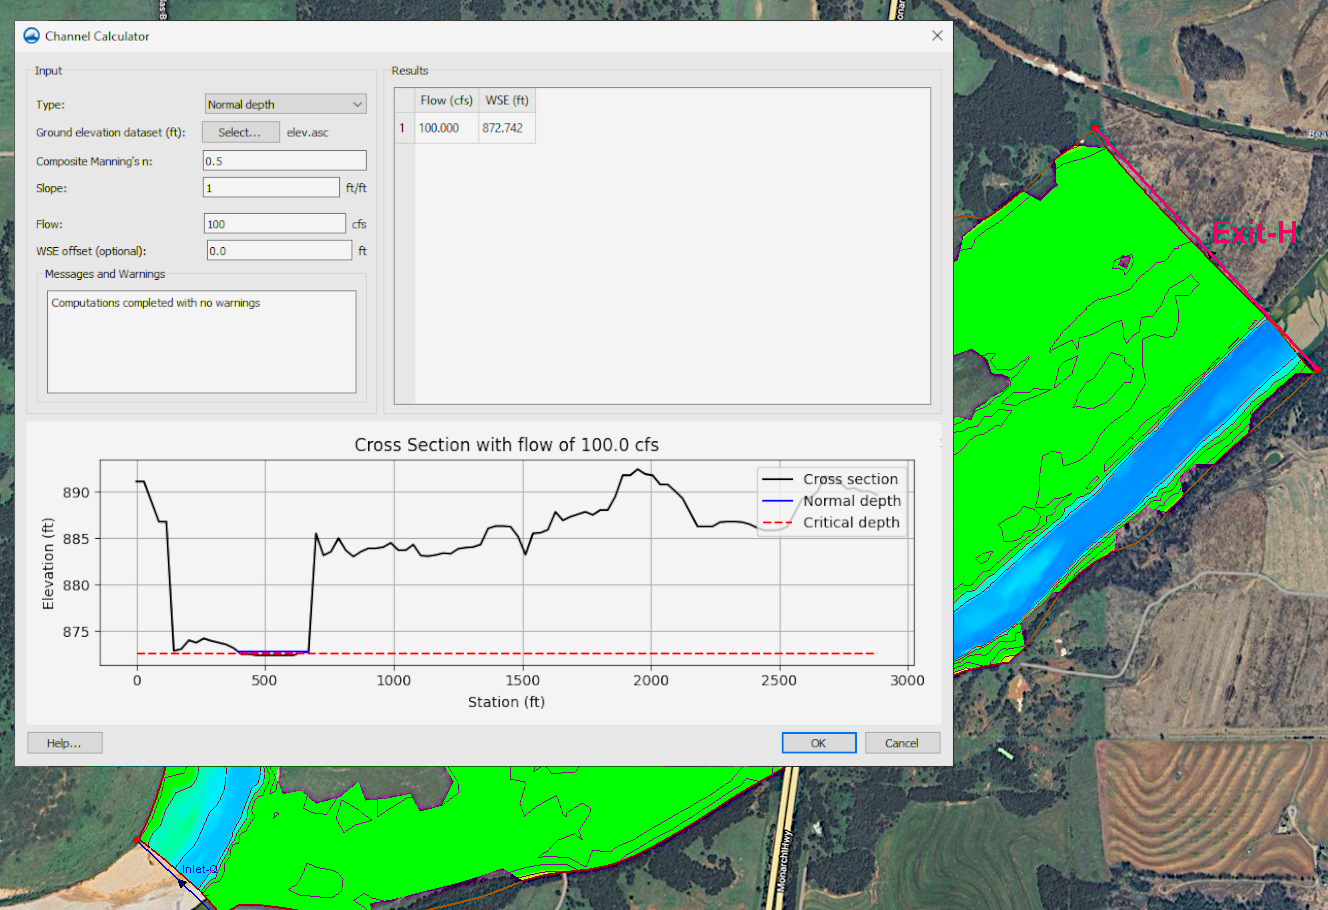
The Channel Calculator specifies a composite roughness value, slope, and flow. SMS extracts a ground elevation cross section from a specified underlying elevation data source (mesh) that is used to compute the area and wetted perimeter. The calculator can make use of different types of elevation data sources which include DEMs, meshes, and scatter sets. Roughness and slope values will be required for the final calculation. Other options, such as the WSE offset, are optional and should only be used when necessary for your project.
The Channel Calculator will display a preview of the exit area cross section with normal and critical depth. When the Channel Calculator will save the values entered when exited. The values in the calculator can be changed later if needed.
The Channel Calculator in SMS gives you a useful tool for determining exit water-surface values for your SRH-2D projects. Try using it in SMS today!