SMS

Using Zonal Classification in SMS

Needing to identify part of your model that is prone to flooding? Or do areas of your project need to be marked off as a fish habitat?

While there are many tools in SMS that can be used to designate areas of a project as something different, one of the easier ways is to use Zonal Classification tool.

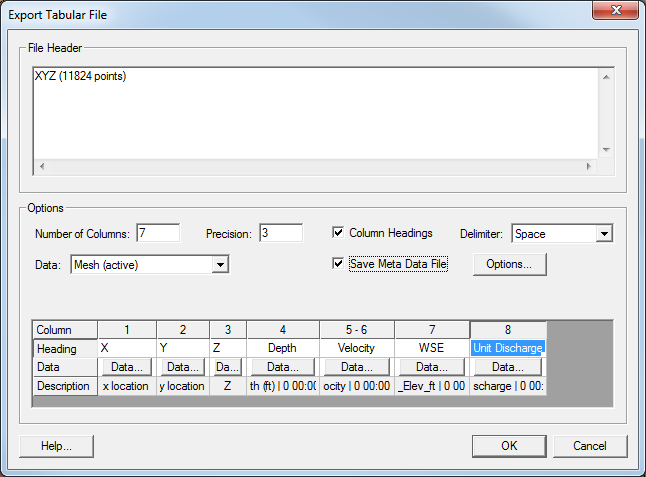
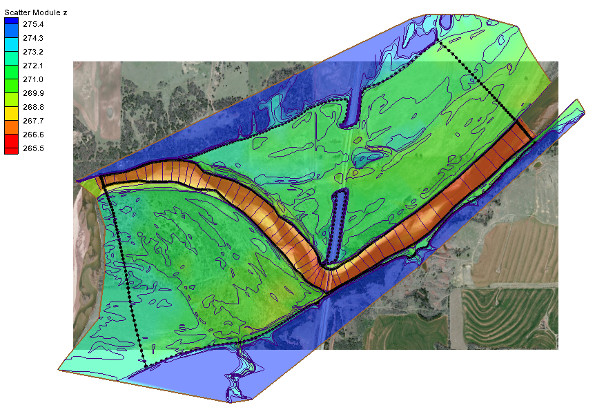
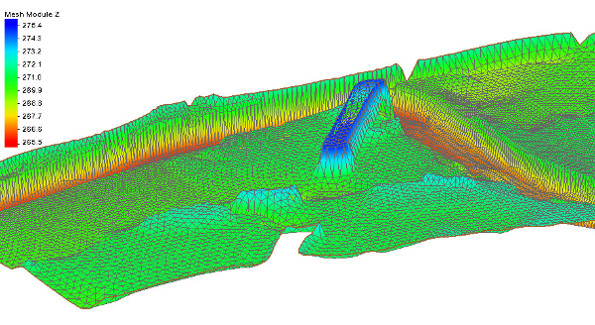
  1. Begin with opening your project containing scalar data. The scalar data can be loaded into the Scatter module, or be part of a 2D mesh or 2D grid.

  2. Next, open the Zonal Classification tool. Do this by selecting the Zonal Classification menu command in the Data menu in either the Scatter, Mesh, or Grid module.


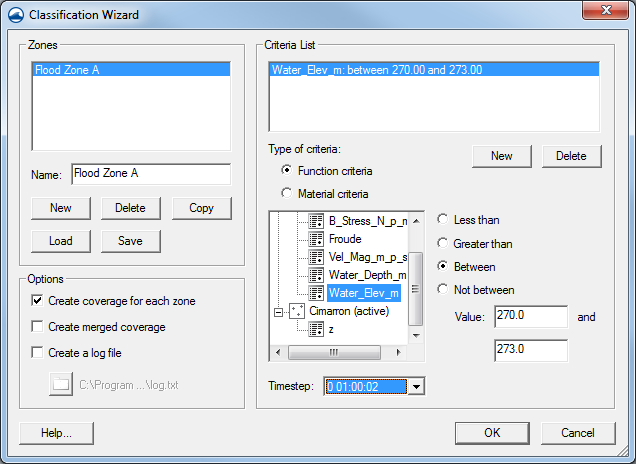
  3. Once the Zonal Classification dialog is open, start setting criteria to define your zones. In the section titled “Zones”, click the New button to create your zone. You can define multiple zones at once while in the dialog.

  4. Once you’ve created your zones, you can define the criteria for each zone. Select the zone and click the New button in the Criteria List section. The criteria can be one of two types: a function criteria or a material criteria.

    As you’ve probably guessed, function criteria use a formula you specify to create the zone. Say you want to identify areas on your mesh below an elevation of 50 feet because those are areas you need to mark off as being prone to flooding. You’ll select the Function criteria option, select your elevation dataset, check the Less than option and enter a Value of 50.

    Similarly, you can choose to create zones based on materials. The materials need to have already been defined in the project before this option can be used. Once the materials are defined, you can create zones that either include or exclude areas of your projects where the zones overlap your scalar data.

  5. Finally, once, you’ve defined your criteria, you can have SMS create a new map coverage with polygons around the defined zone areas.

Try using zonal classification in SMS today!

Blog tags: 

Exporting a Delimited Text File

Sometimes, the best way to share your solution data is through a text file. Data in text files can be formatted in a variety of ways, but delimited text files are supported by the widest range of applications out there.

Creating a delimited text file out of your SMS project is a little different than simply exporting the project as a text file.

  1. Select the Save As command in the File menu.
  2. In the Save As dialog, change the File type to be Tabular Data File (*.txt). This tells SMS you want to create a delimited text file.
  3. Enter a name for your file and make certain it is being saved to the correct directory.

After clicking Save in the Save As dialog, the Export Tabular File dialog should appear. In this dialog, you can specify how you want SMS to organize your file. You can select how many columns you want to have in your file and how those columns are going to be separated using a space, tab, or comma.

Importantly, you will need to select which data you want to have exported. You can select which mesh, grid, or scatter set you’d like to use, then define what will go in each column of the file.

The names of the column heads can be specified. If this option is used, the name of each column must entered in the column spreadsheet at the bottom of the dialog.

Clicking on the Data buttons in the column spreadsheet at the bottom of the dialog will bring up a dialog that lets you pick which datasets to include in each column. Normally, this will be your x, y, and z values. However, if you have more columns you can include other datasets. Both steady state and transient data can be exported.

You can also choose to have metadata saved with your file. This could include data such as the project projection or a polygon around the data boundaries.

Once done with organizing your file, click OK in the Export Tabular File dialog to save out your file. You can now send the text file to colleagues or use it in other projects with any software that can support a text file.

Try creating a delimited text file in the SMS today.

Blog tags: 

3 Great Features in SMS 12.3 Beta

Every new version of software comes with many new features and updates. The release of SMS 12.3 Beta is no different, with scores of updates and tweaks to make the user experience better. Most of these changes are behind the scenes, but we’d like to highlight three features which will prove very useful to our users.

1. Generating an observation arc plot

Right-clicking on an arc in an observation coverage now has the option to directly generate an observation profile plot from the selected arc. This allows you to see the elevations for the stream at that location. It is also faster than using the Plot Wizard. Simply use the Select Feature Arc tool to right-click on the specific arc and select Show Observation Plot.

2. Transparency options for filled polygons in the Map module

A transparency can now be set for filled polygons in the Map module. This means that materials coverages and other filled polygons can be better aligned with other coverages and GIS data such as background maps. Open the Display Options dialog, select "Map" from the list on the left, and turn on Fill in the Polygon section to access the Transparency slider.

3. Setting the Default Contour Range options

Some models include spin up or ramp times during which the numerical results are not within a typical range. This option provides a method for instructing SMS to skip these atypical or unreasonable values from impacting the default ranges of the contours computed.

Select Edit | Preferences… to bring up the Preferences dialog, then click Default Range Options in the Transient Contours section of the General tab to bring up the Default Transient Contour Range dialog. The dialog allows the first n time steps or hours to be skipped when creating the contour range, or to use the current time step.

Try out these features today by downloading the SMS 12.3 Beta.

Blog tags: 

How to Make an Unstructured Floodplain Mesh

Flooding can cause significant--and sometimes devastating--damage to infrastructure, crops, and commercial, residential, and industrial buildings. Unstructured floodplain meshes can be used to anticipate the most likely scenarios and plan prevention and mitigation accordingly. These are only some of the reasons why an unstructured floodplain mesh might need to be created. Your project may include multiple low lying areas that historically flood. You may need to see where berms or channels need to be adjusted to better accommodate sudden flow increases and prevent or mitigate flooding.

There are a few steps that should be taken anytime you model and simulate an unstructured floodplain mesh. SMS simplifies this process.

1. Import Background Data

The first step is usually to import elevation data from a scatterpoint dataset, raster objects, lidar data, mesh, grid, or from an existing project that includes the required elevation information for the floodplain. If the elevation data is not from a scatter set, it will need to be converted to a scatter set or interpolated to the mesh after the mesh is generated.

An aerial photo of the area can also be imported to help with visually referencing rivers, roads, and other structures.

2. Create a Mesh Generator Coverage

Once the elevation data has been imported, create a mesh generator coverage by right-clicking in the Project Explorer and selecting the New Coverage command. From the New Coverage dialog, select the Mesh Coverage type and enter a name for the coverage.

3. Create Feature Objects

The unstructured floodplain mesh will be generated from polygons in the mesh generator coverage. On the mesh generator coverage, create the enclosed arcs encompassing the area of the floodplain using the Create Feature Arc tool. Turn the enclosed arcs into a polygons by using the Build Polygons command.

4. Assign Mesh Type and Bathymetry

Use the Select Feature Polygon tool to double-click on each of your polygons. In the dialog that appears, assign the mesh type you want to create. You can use the Preview Mesh button to ensure your mesh will generate correctly.

After selecting the mesh type, select constant value or scatter set to use as the mesh elevation.

Once this is done for all your polygons, you are ready to generate your unstructured floodplain mesh.

5. Generate the Unstructured Floodplain Mesh

The process of generating your mesh is quite simple if the above processes are followed. Simply right-click on the mesh generator coverage and select the Convert to 2D Mesh command. SMS will start the calculations to create the mesh. Older versions of the software will bring up an options dialog where a few changes can be made to how the mesh is generated. For most projects, the default options are acceptable. A dialog will then appear asking you to name your mesh—the final step in creating the mesh.

Now you have an unstructured floodplain mesh. Explore the mesh to see if you like the results and get started on the rest of your project. You can adjust the display options at this point to make sure your mesh is satisfactory.

You can try out creating unstructured floodplain mesh generation in the SMS Community Edition for free.

Blog tags: 

Pages