SMS

Common Installation Issues with XMS

Are you having trouble installing GMS, SMS, or WMS? Here are three common installation issues, and how to overcome them.

Virtual Machines

The main issues when using virtual machines is selecting the correct type of installation. Single-user locks are not compatible with virtual environments. If you are trying to install XMS with a single-user lock and a virtual machine is detected, XMS will not install. You will need a network lock to get around this issue. Network locks are designed to be used with virtual machines. Single-user locks are not capable of being used as a network lock.

Firewalls and User Permissions

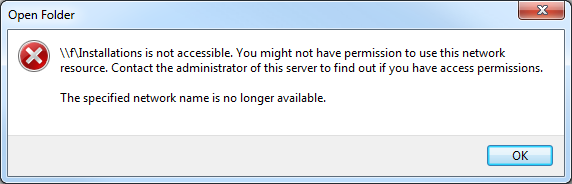
Sometimes, a good password will fail to install XMS, This is because your computer actually needs to contact our servers to verify the authenticity of the password. When an internet error comes up, it's typically related to a firewall, user permissions, or antivirus software blocking the connection to our servers.

Try one of these solutions to resolve this issue:

  • Whitelist which ever XMS program you are trying to install and the registration wizard.
  • Temporarily disable the firewall/antivirus software.

Note that firewalls are typically something each company's IT department handles.

If you are running Windows 8 or 10, and you are not running in a virtual environment, then the issue could be caused by a Windows feature called Hyper-V. Disabling Hyper-V can resolve the problem. You can find instructions on how to disable Hyper-V by reading this article.

Hardware locks

When installing a hardware lock, be sure to have your drivers installed and running before attempting to register the lock. Additionally, please also ensure that the lock is plugged into the computer at the time you are attempting to register. (Note that as a security measure, the reburn cannot take place remotely.) For instructions on how to install your specific type of hardware lock please visit our page here.

Feel free to contact our technical support team at support@aquaveo.com for more individual help in troubleshooting any of these problems. Please recognize that Aquaveo technical support can only help troubleshoot individual machine issues to a certain point.

Blog tags: 

How to Generate a Flood Depth Raster

After running your model, such as SRH-2D, you will have a water surface elevation (WSE) dataset. Did you know that, starting in SMS 13.0, you can use the WSE dataset to create a raster showing the flood depths?

SMS can create a flood depth raster by using the WSE solution dataset at a specific time step and comparing it to the initial elevation data. Using both of these datasets, it can then generate a raster that shows the flooded areas for a specific time step.

In order to create a flood depth raster your project will need a WSE solution dataset and an elevation raster. Once you have a raster:

  1. Select the desired time step for your WSE solution dataset.
  2. Right-click on the raster and select Convert To | Flood Depths.
  3. In the Select Geometry and Dataset dialog, select a geometry containing your WSE solution dataset. The selected geometry can be either a 2D mesh or a 2D scatter set.
  4. Next select the WSE solution dataset.
  5. Click OK to close the Select Geometry and Dataset dialog, which will launch the Save As dialog.
  6. Creating a name for your raster and click Save. (Note that the file should be saved as a "GeoTIFF Files (*.tif)".
  7. Hide the mesh and elevation raster to be able to view your new flood depth raster.

It should be noted that it may take a few minutes for the flood depth raster to be generated depending on the available processing power of your machine. Since a raster file is saved during the process, the file is available for use in other applications if desired. Coordinate data is saved with the file.

Now that you know to create flood depth rasters, try using them in your SRH-2D projects in SMS.

Blog tags: 

Using Internal Sinks and Links in SRH-2D

Do you have an SRH-2D project that requires placing a drain inside the mesh? Or perhaps you have two seperate meshes in your project where you need to have water flowing between them? Both of these scenarios can be resolved by respectively using the internal sink and link boundary conditions.

Internal Sink Boundary Condition

The internal sink boundary condition is assigned to an arc on an SRH-2D boundary condition map coverage. Unlike an inflow or outflow boundary condition, an internal sink is assigned to an arc that is inside the mesh boundaries.

An internal sink can simulate wells, drains or other points of outflow. It can also simulate a source by specifying a negative number for the flow.

It should be noted that an internal sink boundary condition should not be used as a model’s primary source of inflow or outflow. Inflow and outflow boundary conditions should be placed on the mesh boundary.

Links

Link boundary conditions can be used to simulate moving water between two different meshes or two different areas of the same mesh. Links can sometimes be used to make a simple representation of a pipe or similar structure connecting two areas.

Links are made by making two arcs on an SRH-2D boundary condition coverage. Both arcs are selected when assigning the Link property type. One arc should be assigned as the link inflow boundary condition and the other arcs should be assigned as the link outflow.

Example of an link boundary conditions

It should be noted that link boundary conditions should not be used to model culverts or other such structures. Also, link boundary conditions should not be used as the primary inflow or outflow source for a project.

Now that you know a little more about using internal sink and link boundary conditions, try using them in your SRH-2D projects in SMS.

Blog tags: 

Using the Plot Data Coverage

Have you generated a plot in SMS and found it was difficult to see where a bridge, culvert, or other structure location matched up with the plot? The Plot Data coverage helps make them more visible, making an observation coverage more meaningful in a profile plot.

Typically, a profile shows some desired value such as water surface elevation or the riverbed elevation. This data can be more useful in many cases if structures are displayed on the plot as well. A Plot Data coverage allows creating polygons over structures that then helps display the location of the structure on the plot profile.

To use the Plot Data coverage, do the following:

  1. In the Map Module, create a new coverage with the Plot Data type.
  2. In this new Plot Data coverage, create a polygon over the area of interest.
  3. Double-click on the Polygon to assign attributes in the Plot Data dialog.
  4. Create an observation arc that includes the area of interest.
  5. Create an observation profile plot.
  6. In the Plot Data Options, turn on the Plot Data coverage.

The profile plot will now show where the polygon on the Plot Data coverage aligns with the profile.

Example of a Plot Data coverage used in a plot profile

For example, if you want to consider the impact of a new bridge placement on the flow of a river, you could create a polygon representing the bridge location. When included in the profile, this could help you visualize placing a bridge at that location along the river and at the indicated height. If water elevation data is available, such as from an SRH 2D simulation, the height of the bridge can be easily compared with elevation profile of the water surface. This could be helpful in considering if the bridge would be washed out or flooded during periods of heavy rain when the river swells.

Culverts can similarly be shown on the profile by using the Plot Data coverage. Likewise, obstructions or structures of any shape could also be shown in the profile using the Plot Data coverage. Multiple plot data coverages could be used when there is a desire to layer structures such as a hypothetical bridge and the supporting abutments or columns.

Try out using the Plot Data coverage in SMS today!

Blog tags: 

Pages