5 Ways to Select Arcs in GMS
By aquaveo on July 18, 2018Everyone knows you can select an arc in GMS by using the Select Arcs tool and clicking on the desired arc. But did you know there are five different ways to select one or more arcs? Here’s a quick rundown of all of them:
- Use the Select Arcs tool to click on a single arc. This is the most common way to select an arc, but it only allows you to select one at a time. If you have multiple arcs you need selected, there are better, more efficient ways to select them.
- Use the Select Arcs tool while pressing the Shift or Ctrl key to select multiple specific arcs. This allows you to select only the desired arcs for whatever purpose you wish. This method includes all of the precision of the first method, but can take a long time if you have many different arcs to select. The next three methods allow you to more quickly select larger numbers of arcs.
- Use the Select Arcs tool to drag a box around multiple arcs to select them. All arcs where both nodes of the arc are contained within the box wil be selected. Arcs where one node is outside of the box will not be selected. The click and drag method provides a quick method for selecting multiple arcs, but is not as accurate.
- Use the Select All command in the Edit menu to select all the arcs in the project. Just make sure to have the Select Arcs tool selected first so GMS knows what to select. The Unselect All command can be used to deselect everything when you’re done, if desired.
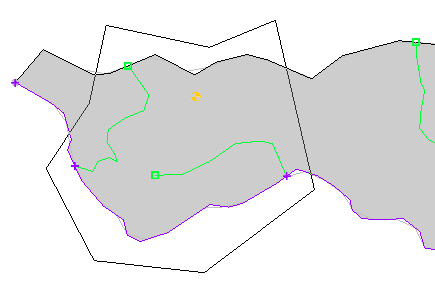
- The Select With Poly command in the Edit menu lets you draw out a polygon around the arcs you want selected. Keep in mind that both ends of an arc must be within the polygon in order for it to be selected.
Try out these options today in the GMS Community Edition.
Edit: This post was updated on 7/20/2018 to correct information in methods 2 and 3.