Having Multiple MODFLOW 6 Simulations in GMS
By aquaveo on February 16, 2022Have you tried including multiple MODFLOW 6 simulations in your GMS project? Having multiple MODFLOW 6 simulations allows you to run simulations for the same area. This can help with calibration, making comparisons, and troubleshooting a model. This post will cover how to keep things organized when using multiple simulations in a single project file.
After you have created a second MODFLOW 6 simulation, it is recommended that you give the simulation a name that will help you remember the purpose of that simulation. For example if you have a base simulation that you are using to create a stable starting run, it could be named something like “Base_Sim”. If you then create a second simulation that has a longer run time, naming it something like “Base_Longer_Run” might be helpful.
Furthermore, you can use the Notes feature available in the simulation properties dialog to add notes about what makes each of the simulation unique. This can be particularly helpful when sharing the project with coworkers.
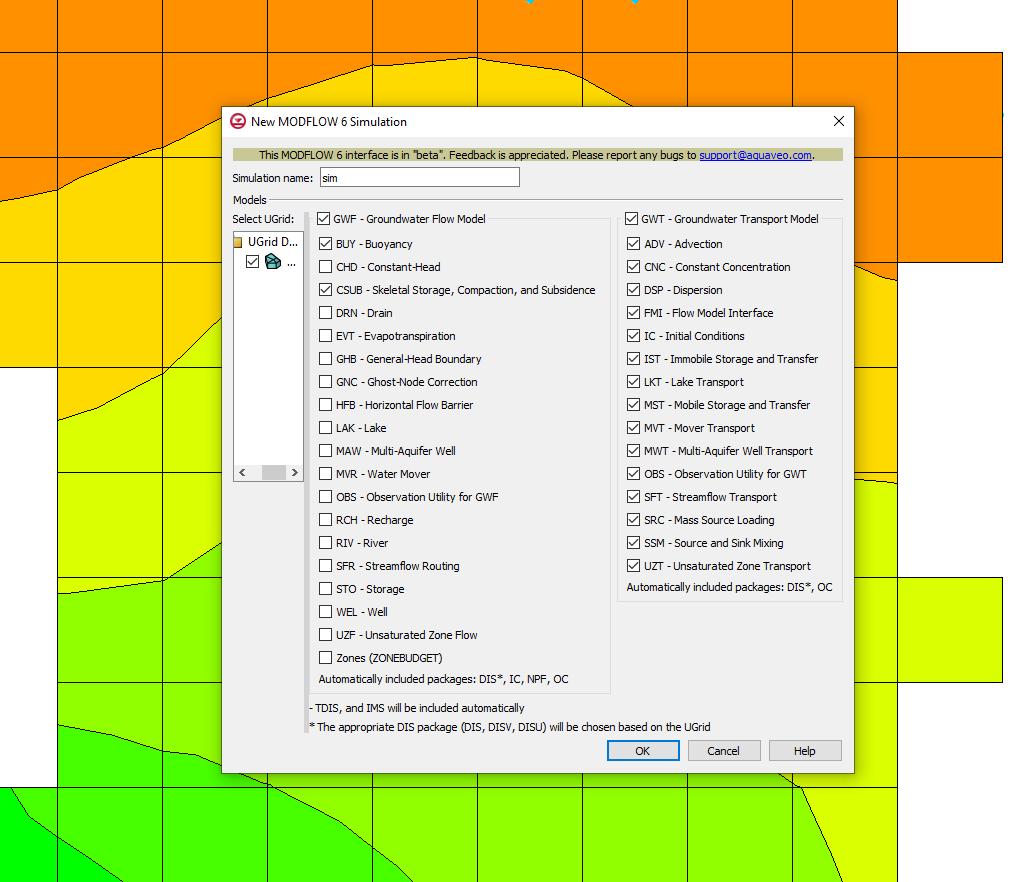
In some cases you may have multiple UGrids. For example, you may want to use one UGrid that is less refined for a simulation for a base simulation and a more refined UGrid to test with a duplicate simulation. When doing this, be certain to correctly name the UGrids so that they are easy to tell apart. Also, make certain the UGrid is linked to the correct MODFLOW 6 simulation. It is usually best to create a separate simulation for each UGrid.
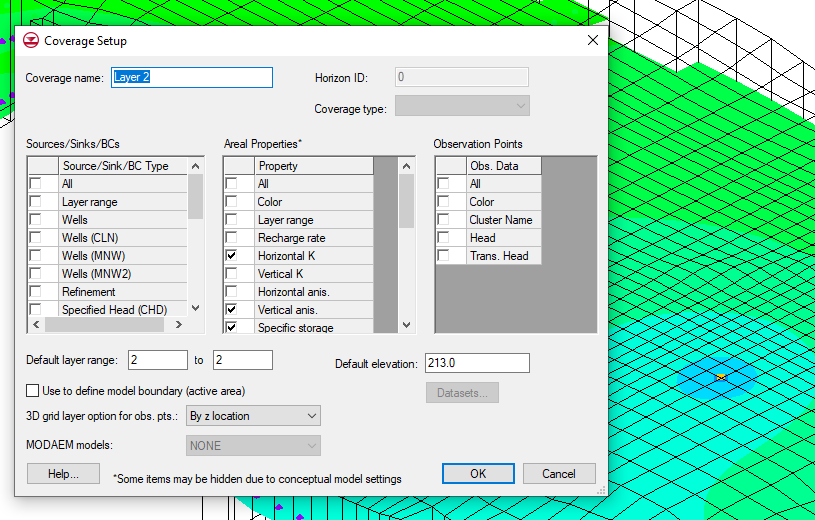
Often when using multiple simulations, you will want to have specific map coverages applied to specific simulations. When doing this, you can organize your coverages in the Map module using folders. Using folders can help keep straight which coverages belong with which simulation. And can also help in keeping the Project Explorer from becoming cluttered.
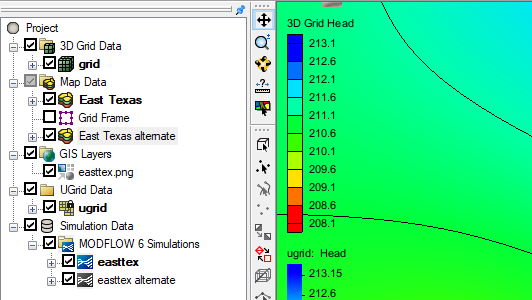
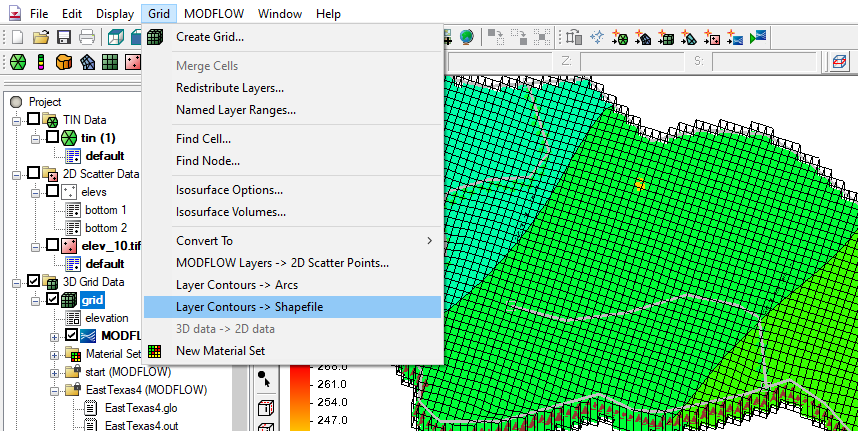
In the Project Explorer, collapse any folder that you are not currently using. This will help keep the Project Explorer free of any unnecessary clutter. This is particularly helpful when you have solution data from different simulation runs. GMS will automatically place simulation solution files in their own folder in the Project Explorer under the UGrid connected to that simulation, as well as as links under the simulation. Additional folders can be added to organize solution data.
Also, when working with multiple simulations, it can be helpful to lock simulations that are not currently being worked on to reduce chances of accidentally making changes to the wrong simulation.
It should also be noted that having too many simulations in a project can cause GMS to run slowly. It is typically recommended to have fewer than seven simulations in a project.
Having multiple MODFLOW 6 simulations in your project expands your groundwater modeling options. Try out using multiple MODFLOW 6 simulations on your project in GMS today!