Quickly Delineating a Floodplain
By aquaveo on October 31, 2018How many watershed projects require knowing which areas are in a floodplain? There is a lot of debate over building on floodplains, but before that debate can happen, the location of the floodplain needs to be known.
A new feature in WMS makes this process quick and simple.
The Map Flood tool utilizes ground elevations and existing flood hazard maps from the Federal Emergency Management Agency (FEMA) to quickly visualize the impacts of possible modifications in the flood level. The tool is designed to utilize data from web services including ground elevations, flood hazard base flood elevations, and flood hazard floodplain extents.
The Map Flood tool is accessed by clicking on the Map Flood icon in the toolbar.
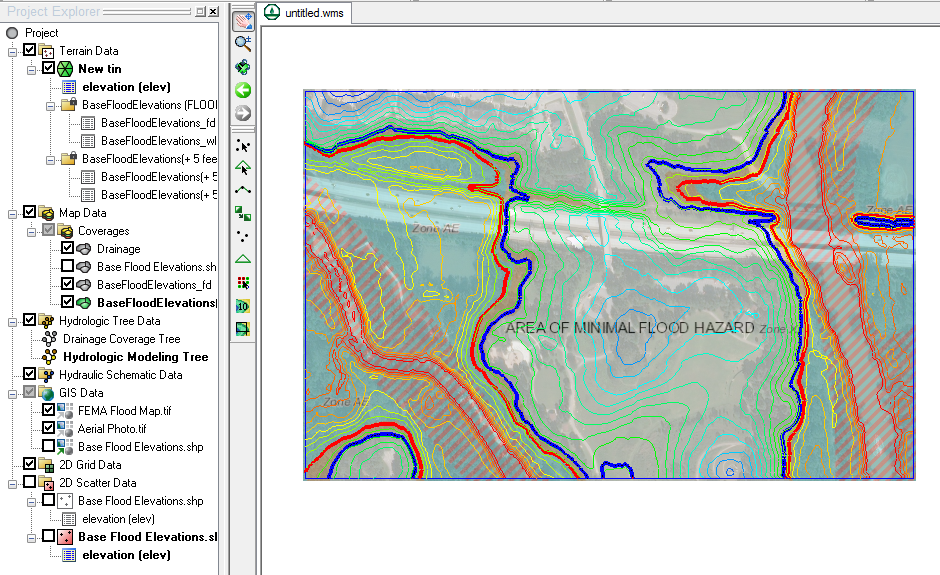
Running the tool will do the following:
- Download elevation data for the area which is stored as a scatter set
- Download base flood elevation lines for the area which is stored as a map coverage
- Download a flood extents polygon which is stored as a map coverage
- Download a flood insurance map as a image in the GIS module
- Create a water surface elevation for the base flood
- Create an offset water surface elevation for the modified flood level
- Compute a new flood extent polygon for modified flood level
For locations that do not have FEMA data, you can use your own data to generate flood extents. As long as a ground elevation dataset and a water surface elevation have been imported into a WMS project, then the Map Flood tool can be used to create a fast floodplain. This data needs to be imported into WMS as either a 2D scatter set or a TIN.
Using the new Map Flood tool can greatly reduce the time it takes to delineate a floodplain. Try out the new Map Flood tool in WMS 11.0 today!