WMS

3 Ways to Troubleshoot WMS Basin Issues

Have you noticed your model’s basin isn't what you hoped it to be? When you create a solid watershed model, there are a few common issues that can make the model not work as intended. These include:

  1. Having a flow accumulation threshold that is too low or too high.
  2. Having one or more outlets in the wrong location for proper definition of the sub-basins and basins.
  3. Trying to work with a project area that is too large or too small for the intended purpose.

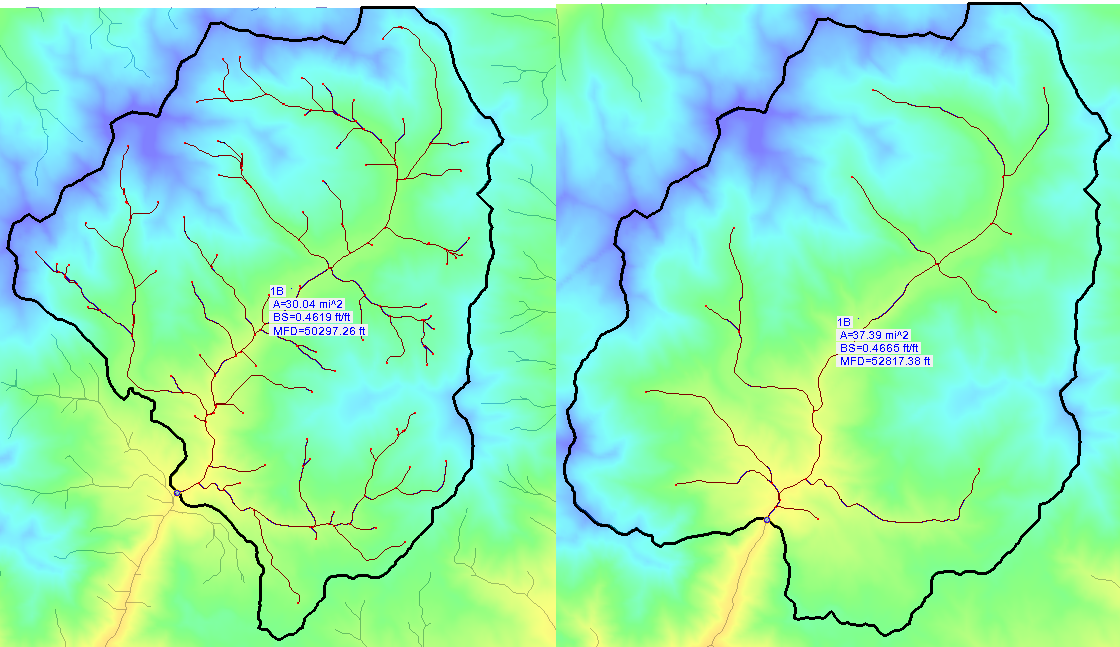
Flow Accumulation Threshold

Setting the correct flow accumulation threshold is very important. If you set the flow accumulation threshold too low, it may not accurately show the information you need, leaving sections of the watershed model reporting dry conditions. If you set it too high, you can be overwhelmed with too much information. It is good practice to try multiple levels to see which provides the most accurate results for the project. You can adjust this setting by doing the following:

  1. Open the Hydrological Modeling Wizard dialog.
  2. Select Compute Flow Directions and Accumulations (TOPAZ) from the list on the left.
  3. Enter the desired Min flow accumulation threshold and close the dialog.

Adjusting the Outlet

Placing an outlet in the wrong location causes the entire structure of the stream system to change dramatically. This can produce sub-basins quite different than desired, which can lead to results not lining up as expected. Remember that everything upstream from an outlet will be part of the same sub-basin or basin, so be careful when placing your outlets for each sub-basin as well as for the full basin.

Project Area

Sometimes, you may select a larger area than necessary for your model, or you may select an area too small for the project to produce useful results. If the area is too large, the desired details may not show up in your results. If the selected area is too small, you may not have enough data on which to base your decisions for the watershed.

If you keep these ideas in mind, your watersheds will better represent the areas you're modeling. Experiment with this today in the WMS Community Edition.

Blog tags: 

Computing Basin Curve Numbers in 9 Easy Steps

Need to predict direct runoff or infiltration from rainfall excess? Computing a curve number (CN) is a common solution to this problem. The curve number method was developed by the USDA Natural Resources Conservation Service using empirical analysis of runoff from small catchments and hillslope plots.

To calculate a CN you will need the hydrologic soil groups, land use data, and rainfall conditions for a given area. You then need to enter the values for the CN equation to get your final values. While you could calculate a CN manually, WMS can do the work for you.

  1. Import data for the area, either as map coverages or as GIS data. It is import that you review this data for accuracy before using it to compute a curve number. Required data includes land use data and soil type data.
  2. Create a land use ID table file. This can be done in any text editor and should be saved as a standard text file. Examples can be found in the XMSWiki and in the TR-55 manual.
  3. Make the Hydrologic Modeling module the active module.
  4. Select the Compute GIS Attributes command in the Calculators menu.
  5. In the Compute GIS Attributes dialog, select the SCS Curve Number option.
  6. Select the coverage or GIS layers to use for the calculation.
  7. Import the land use table file by clicking the Import button and selecting the land use table text file.
  8. Once your options are set, click OK to generate your curve numbers.
  9. If needed, in the View Data File dialog, select the text editor to use to see your final curve number results. This dialog may not appear if a default text editor has been selected.

Now you can review the curve numbers in your text file. Try calculating Curve Numbers in WMS Community Edition today!

Blog tags: 

2 Ways to Import ArcGIS Files into WMS

ArcGIS software has long been a standard in generating geographic data. It is likely you will have received a shapefile generated in ArcMap at some point. ArcGIS files can be imported into WMS to save you time in recreating geographic data.

There are two main methods for importing ArcGIS data: through the standard open dialog or through the GIS module.

Standard Method

To import ArcGIS files into WMS:

  1. Select the Open command in the File menu.
  2. Make certain the Files of Type field is set to "All Files" or "Shapefiles".
  3. Browse to your file and open it.

That’s all you need to do. You can also use any other standard methods for opening files such as using the Open macro or dragging the file onto the Graphics Window. There is also a command to open shapefiles in the Data menu in the GIS module.

Right-clicking on the the imported shapefile in the GIS module allows joining table and layer data. This data can then be mapped onto a coverage using the Shapes → Feature Objects command in the Mapping menu.

A grid coming from ArcGIS will be imported as a DEM in the Terrain Data module . A TIN will also be imported into the Terrain Data module.

GIS Module

When the GIS Module is active, you can use commands to directly import ArcGIS data into WMS. To do this:

  1. Make certain the GIS module is active.
  2. Select the Data | Add Shapefile Data command.

  3. or

  4. Select the Data | Add GIS Data command.
  5. Use the file browser to locate your files and import them.

This second method is useful for a wider range of ArcGIS data files. If a file does not open correctly using the standard methods, then importing the file through the GIS module is recommended.

DEMs and TIN files opened through the GIS module will be imported into the GIS module instead of the Terrain module.

Take a look at what other GIS tools are offered in WMS.

Blog tags: 

3 Ways to Download Images in WMS

Many projects start with an image, because we like to see what we’ll be working on. It’s always possible to import an image file, but if you don’t already have an image file, then what? Well, when WMS is able to access the internet, it can download an image for you.

The advantages of online images are that they can be seamlessly integrated into projects, data is available for locations throughout the world, and they can be reprojected to the display projection without needing to georeference the image.

To download an image, WMS provides three tools: Get Online Maps, Get Data From Map, and the Get Data tool.

1. Use the Get Online Maps Tool

The Get Online Maps tool connects to a data server where real world images and data can be downloaded into your project. To use the Get Online Maps tool:

  1. Click on the Get Online Maps macro 
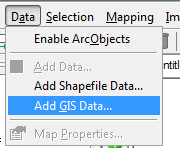
. This will bring up the Virtual Earth Map Locator dialog, if there is not a projection already set in the project.
  2. In the Virtual Earth Map Locator dialog, find the location where you want to retrieve data.
  3. Next, the Get Online Maps dialog appears where you select which type of data you want to retrieve, (i.e., a topographic map or elevation data).
  4. Download the image.

The downloaded image is a dynamic image. This means it will redownload data when you zoom in or out in WMS. The image has not been saved locally at this point. To save:

  1. Right-click and select Export.
  2. Use the Resample and Export Raster dialog.
  3. Enter the file name.

This saves a static image to your hard drive. It can then be used again in the future.

2. Use the Get Data From Map Tool

If you don’t want to get a dynamic image, you can skip directly to downloading a static image. To do this:

  1. Click on the Get Data From Map icon to bring up the Virtual Earth Map Locator.
  2. Select the desired location in the Virtual Earth Map Locator dialog. If you have a projection set or have previously downloaded an image, this dialog will be show that area.
  3. The Data Services Options dialog will appear next. Select the type of data you want to retrieve.
  4. WMS will then ask you to save the file as a static image before downloading the data into your project.

With the Get Data From Map tool, you have a static image ready for use in your project with the file available for other projects if needed.

3. Use the Get Data Tool

The Get Data tool allows you to retrieve an image for a specific location in your project. The project display projection must be set to an appropriate “Global projection” option for this to work.

  1. Select the Get Data icon and draw a box in the Graphics Window to select the desired area for the image.
  2. Select a data type in the Data Services Options dialog.
  3. You will then be asked to save the file as a static image.

Now you will have image data that only covers the area you drew out in the first step. This is helpful when you only need a specific piece of data, or data only for a specific location.

Try out these three ways to download image data in WMS today. We recommend experimenting a little so you can learn all the different ways these images can be used.

  • Note that in 2017, the server used by the WMS online map tools was discontinued by Microsoft. A new server has been selected and is used in the current version of WMS. Because of this, older versions of WMS may not be able to use the online map tools.
Blog tags: 

Pages