WMS

Visualizing Meteorological Data

Do have rainfall data you would like to visualize in WMS? Inside WMS there are a couple tools to make your rainfall data visually interesting.

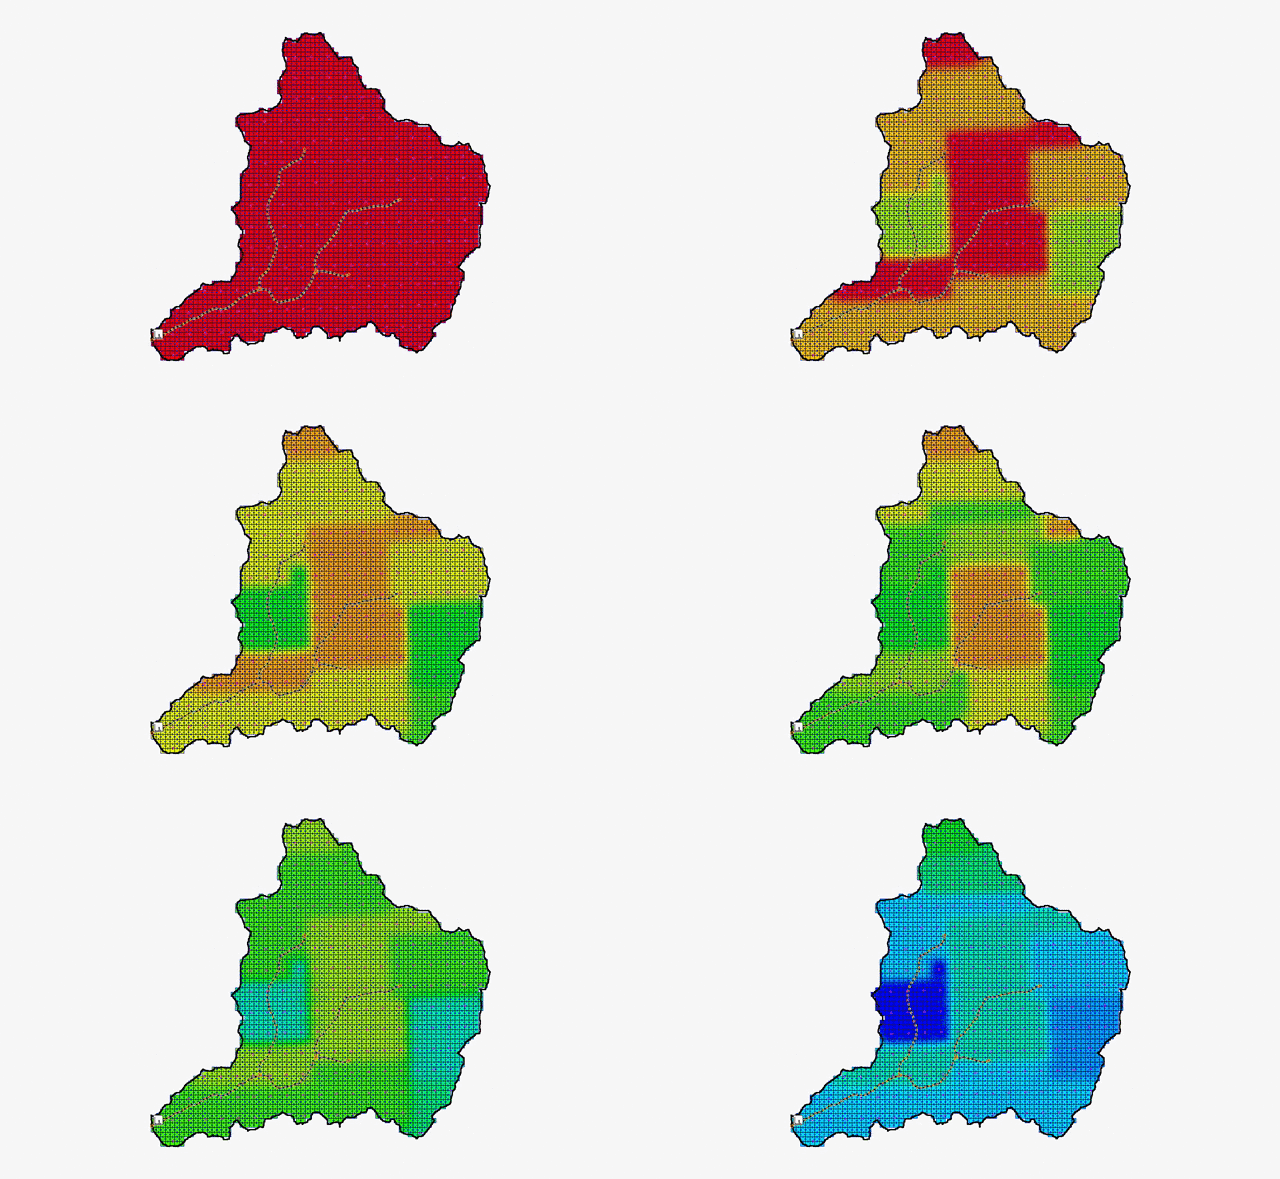
After you have imported your precipitation data, such as NEXRAD data, you can adjust your display options and/or create an animation.

Adjusting the Display Options

  1. Use the Display | Display Options command to open the Display Options dialog.
  2. Adjust your display options to show the data you want captured. It is recommended to turn on the Contours options.
  3. If using the Contours option, right-click on your rainfall dataset under 2D Grid Data and select Contour Options to open the Contour Options dialog.
  4. Adjust the contour method and interval to best display your rainfall data.
  5. With the down arrow key on the keyboard, step through the time steps in the properties window on the right sidebar to see how the precipitation varies.

Creating an Animation Loop

  1. Select your rainfall dataset in the 2-D Grid Module. The selected dataset will be used to create the film loop and can be cumulative or incremental. View incremental rainfall datasets in the same way as cumulative datasets.
  2. Select the Data | Film Loop command to open the Film Loop Setup Wizard. This wizard needs to be opened with the 2-D Grid Module active in order to have access to the meteorological data options.
  3. The first step in the Film Loop Setup wizard is essentially the same as creating any other animation through WMS. Select the location where the animation file will be saved and the type of film loop to generate.
  4. The second step of the Film Loop Setup wizard is to set the desired time step options for the rainfall data.
  5. The final step is where you will finalize the display options of the animation, and click Finish.
  6. WMS will take a few moments to create and save the animation file. The animation will start playing as soon as the saving process is complete.

When all is done, you can view your animation using the AVI play provided with the WMS installation, or you can use another application, such as GoogleEarth. The animation will display the movement of the storm through the selected time steps.

Try visualizing meteorological data in WMS today!

Blog tags: 

Using Software Graphics Mode

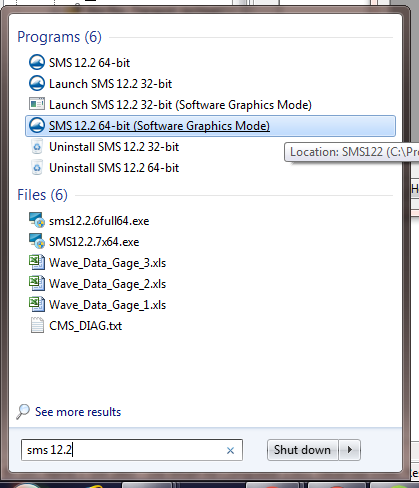
Have you ever noticed in your Start Menu that GMS, SMS, and WMS all have a version of the software executable that says "Software Graphics Mode"? Do you wonder what this is used for?

The software graphics mode was created to help resolve issues when there is a mismatch between the XMS software and the graphics card on a computer running the software. While we work to have XMS function on a wide range of graphics cards, some graphics cards do not support current versions of XMS.

When there is a mismatch, you might experience difficulty running the software. Issues we’ve seen happen include:

  • Having objects disappear from the Graphics Window when drawing new objects.
  • When changing views, objects in the Graphics Window disappear completely when they should still be visible.
  • Objects that appear in the Graphics Window that cannot be hidden or removed.
  • In some cases, the XMS application will not start.
  • In other cases, the XMS application will close suddenly.

Using the software graphics mode causes the machine running the XMS application to bypass the graphics card. Think of it as “safe mode” for XMS. Doing this places a heavier burden on the machine’s memory and processor, but it typically allows the XMS application to be used without the problems being caused by the graphics card.

To access the software graphics mode, go to your Start Menu and select the desired XMS executable with "Software Graphics Mode" in the title.

If using the software graphics mode resolves the issue you were experiencing, there is still one more thing to do: update your graphics card drivers.

Updating your graphics card drivers often resolve the issues being caused by the mismatch between the XMS application and the graphics card. Follow the standard procedure for updating the graphics card drivers for your operating system. In some cases, you will need to go to the graphic card manufacturer's website to update the drivers.

Once the graphic card drivers have been updated, you can usually continue to use the XMS application without using the software graphics mode.

And if updating the graphics card drivers doesn’t work, do not hesitate to contact Aquaveo Support for additional help.

Blog tags: 

3 Ways to Troubleshoot WMS Basin Issues

Have you noticed your model’s basin isn't what you hoped it to be? When you create a solid watershed model, there are a few common issues that can make the model not work as intended. These include:

  1. Having a flow accumulation threshold that is too low or too high.
  2. Having one or more outlets in the wrong location for proper definition of the sub-basins and basins.
  3. Trying to work with a project area that is too large or too small for the intended purpose.

Flow Accumulation Threshold

Setting the correct flow accumulation threshold is very important. If you set the flow accumulation threshold too low, it may not accurately show the information you need, leaving sections of the watershed model reporting dry conditions. If you set it too high, you can be overwhelmed with too much information. It is good practice to try multiple levels to see which provides the most accurate results for the project. You can adjust this setting by doing the following:

  1. Open the Hydrological Modeling Wizard dialog.
  2. Select Compute Flow Directions and Accumulations (TOPAZ) from the list on the left.
  3. Enter the desired Min flow accumulation threshold and close the dialog.

Adjusting the Outlet

Placing an outlet in the wrong location causes the entire structure of the stream system to change dramatically. This can produce sub-basins quite different than desired, which can lead to results not lining up as expected. Remember that everything upstream from an outlet will be part of the same sub-basin or basin, so be careful when placing your outlets for each sub-basin as well as for the full basin.

Project Area

Sometimes, you may select a larger area than necessary for your model, or you may select an area too small for the project to produce useful results. If the area is too large, the desired details may not show up in your results. If the selected area is too small, you may not have enough data on which to base your decisions for the watershed.

If you keep these ideas in mind, your watersheds will better represent the areas you're modeling. Experiment with this today in the WMS Community Edition.

Blog tags: 

Computing Basin Curve Numbers in 9 Easy Steps

Need to predict direct runoff or infiltration from rainfall excess? Computing a curve number (CN) is a common solution to this problem. The curve number method was developed by the USDA Natural Resources Conservation Service using empirical analysis of runoff from small catchments and hillslope plots.

To calculate a CN you will need the hydrologic soil groups, land use data, and rainfall conditions for a given area. You then need to enter the values for the CN equation to get your final values. While you could calculate a CN manually, WMS can do the work for you.

  1. Import data for the area, either as map coverages or as GIS data. It is import that you review this data for accuracy before using it to compute a curve number. Required data includes land use data and soil type data.
  2. Create a land use ID table file. This can be done in any text editor and should be saved as a standard text file. Examples can be found in the XMSWiki and in the TR-55 manual.
  3. Make the Hydrologic Modeling module the active module.
  4. Select the Compute GIS Attributes command in the Calculators menu.
  5. In the Compute GIS Attributes dialog, select the SCS Curve Number option.
  6. Select the coverage or GIS layers to use for the calculation.
  7. Import the land use table file by clicking the Import button and selecting the land use table text file.
  8. Once your options are set, click OK to generate your curve numbers.
  9. If needed, in the View Data File dialog, select the text editor to use to see your final curve number results. This dialog may not appear if a default text editor has been selected.

Now you can review the curve numbers in your text file. Try calculating Curve Numbers in WMS Community Edition today!

Blog tags: 

Pages