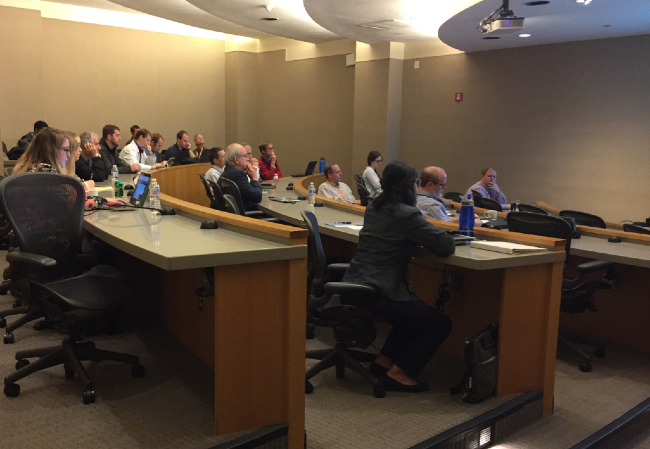
Aquaveo User Conference 2019
By aquaveo on October 9, 2019The 2019 Aquaveo User Conference is going on now. It started yesterday, October 8th, and will wrap up today, October 9th. We are enjoying meeting with users from around the world. In attendance are users from the United States, Germany, Portugal, South Africa, and other places around the globe.
At the conference, we announced some of the new features and upcoming changes to our products that we are excited about:
- Making XMS functionality available for use outside of the traditional interface.
- More web-based applications for portability and ease of access.
- Simplifying and unifying tools so it is easier to find and use the functionalities available.
- Project management tools to track the history of a model.
- 3D bridge modeling in SMS.
Talking to those in attendance, we learned they enjoyed:
- Learning more about software features and functionality.
- Learning how to improve their model development process.
- Discovering benefits of Aquaveo’s software over other software.
- Talking to developers and learning tips for model development.
- Being able to show off their models and receive feedback on them.
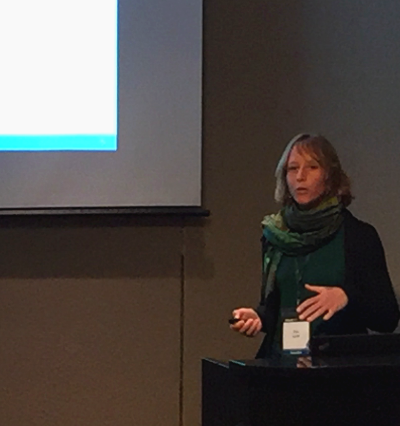
We’d like the thank the following for participating during our user conference:
- Scott Hogan with the Federal Highway Administration
- Scott Kudlas with the Office of Water Supply, Virginia Dept. of Environmental Quality
- Eva Loch with Hydrotec R. Jeffrey Davis with Barr Engineering
- Andrea Borgia with the Lawrence Berkeley National Laboratory
- Yazmin Avila with the City of Austin Watershed Protection Division
- Young-Hoon Jin with the City of Austin Watershed Protection Division
- Antonio Trigo-Teixeira with the Instituto Superior Tecnico, University of Lisbon
- Rute Ramos from the Laboratorio Nacional de Engenharia Civil
- Eric Miller with GeoEngineers
- Mitch Brown with the Coastal and Hydraulics Laboratory, U.S. Army Corps. Of Engineers
- Chris Massey with the U.S. Army Corps of Engineers
If you couldn’t make it to the Aquaveo User Conference this year, watch our website and Facebook page for future conferences.