Modeling a Dam in GSSHA
By aquaveo on May 1, 2019Do you have a project that requires modeling a dam, or similar structure, in GSSHA? WMS can make this process smoother with tools designed to help define the structure quickly and efficiently.
In order to create a simulation that includes modeling the dam in WMS and analyzing the dam’s effects using GSSHA, the workflow is as follows:
- Import an existing GSSHA base model.
- In the GSSHA map coverage, use the Shift key to select the node where you want the dam to be and the node immediately downstream from it.
- Right-click on the selected nodes and select Attributes to open a Properties dialog.
- Select Output Hydrographs at those nodes.
- Run GSSHA.
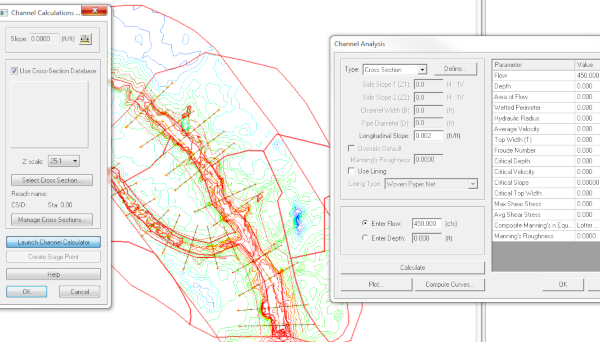
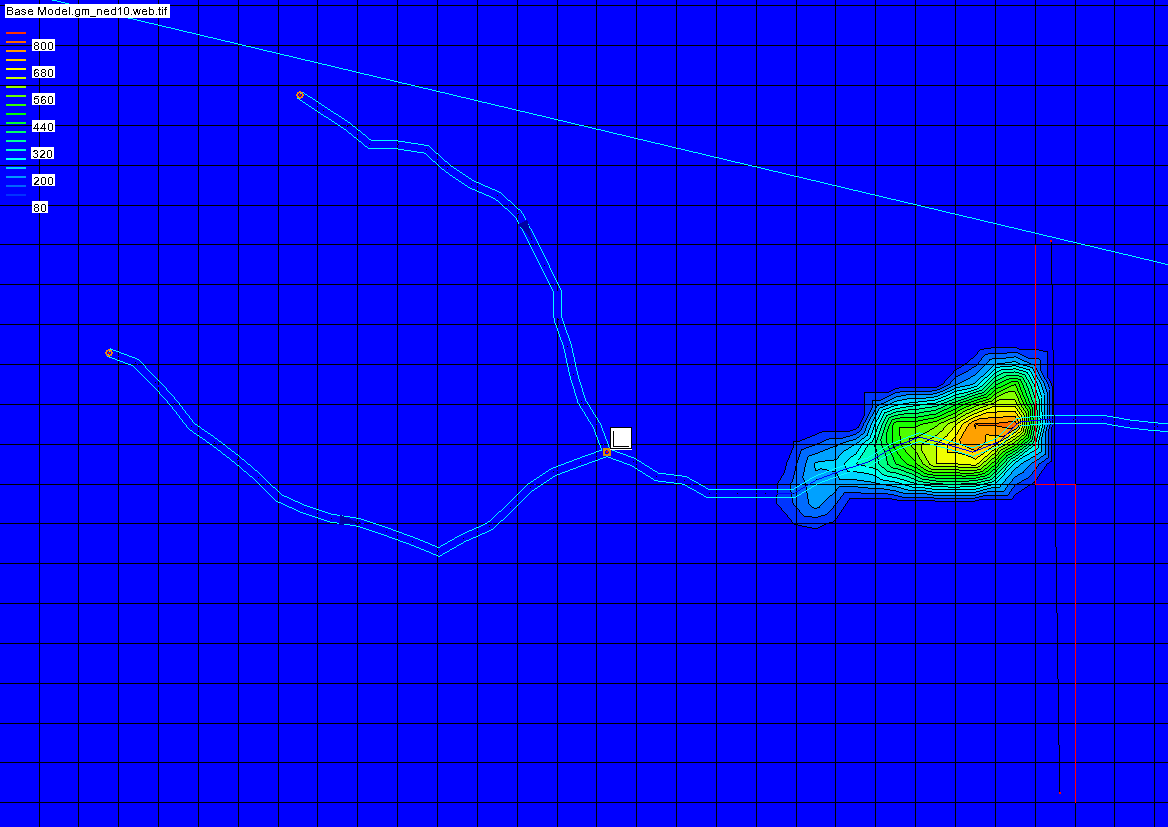
- Using the results from the GSSHA run, size your embankment based on the necessary storage.
- Using the Create Feature Arc tool, create an arc to represent your dam.
- Double-click on the arc to bring up the Attributes dialog.
- Set the type of arc to be an Embankment, then click the ... button next to it to open the Embankment Arc Profile Editor dialog.
- Set the PVI Elevation to be the height of the dam.
- Click Compute Vertical Curve to compute the Curve Length.
- Double-click the node in the stream where your structures will be defined to open the Properties dialog.
- Click the button under Hydraulic structures to open the GSSHA Hydraulic Structures dialog.
- Add a Detention Basin, Weir and Culvert.
- Define the attributes for each of these structures.
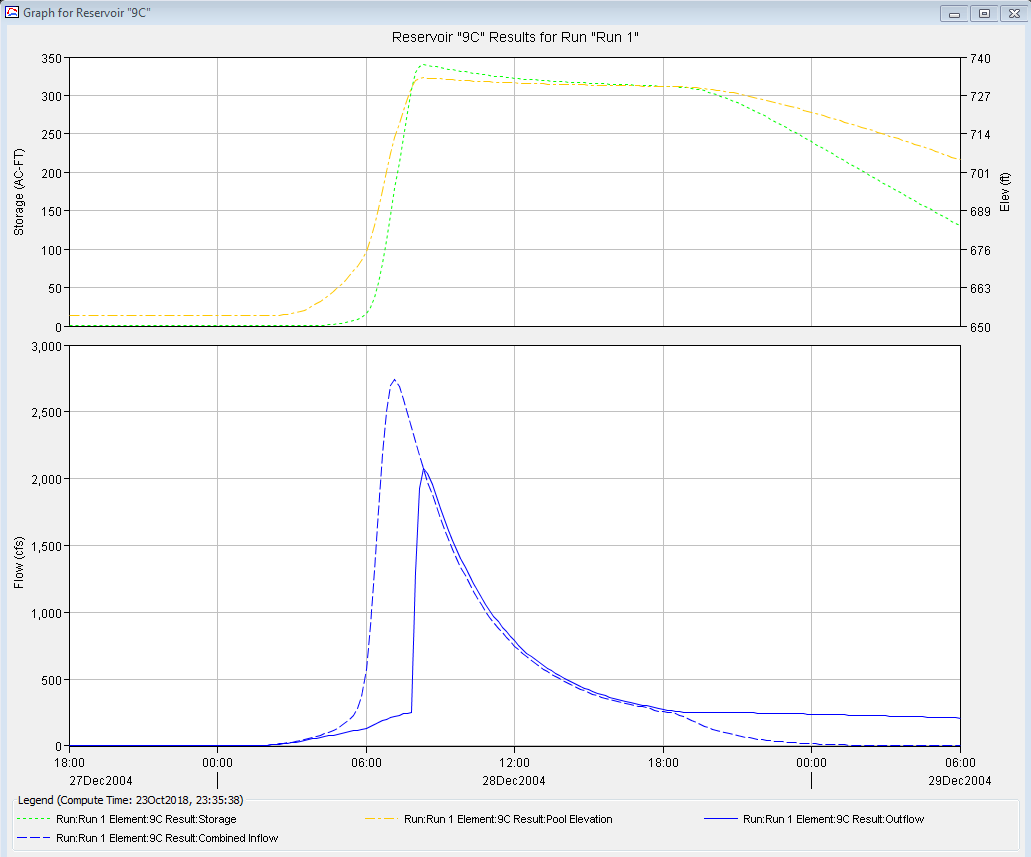
- Run GSSHA again to see the effects of the dam you have created.
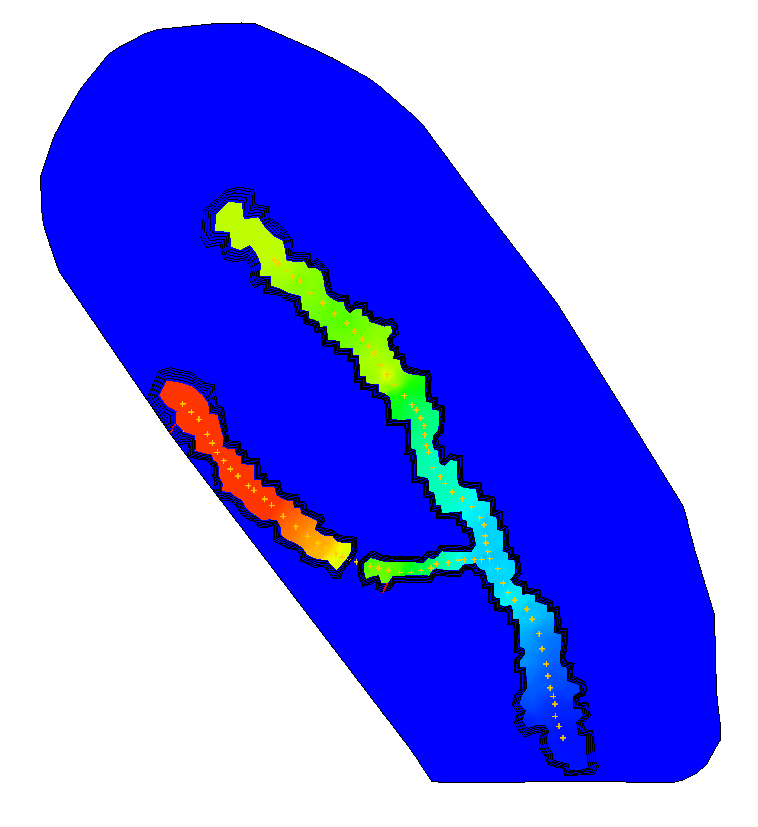
If needed, adjust the display options when reviewing the results to get a better idea of how the dam structure affected the results. Try different various options to get a better feel of how the dam affected the simulation results.
Now that you know how to add a dam to GSSHA, try out modeling dam structures and other applications in WMS today!