Working with Rain Gages in GSSHA
By aquaveo on December 19, 2018Are you needing to add rain gages to your GSSHA model? Using rain gages to define your precipitation in GSSHA is extremely useful due to its ability to spatially model precipitation over a watershed. Combining spatially varying rainfall with the distributed parameters of GSSHA is a great way to create a fairly realistic model for your watershed.
One of the bigger challenges when simulating a storm event is finding reliable data. Although it is important to investigate the most accurate source for your particular watershed, there are websites containing NOAA and GLDAS data for not only the United States, but globally. Having many sources of compiled data all on one site makes Cuahsi’s HydroClient a very useful resource. For those using our software internationally, another possibly useful resource when gathering storm data from the Global Precipitation Climatology Centre. This gives monthly values from 1901-2013, with newer data being added frequently.
Now that you have solid data for your watershed, it is time to define your gages. To use rain gages as your precipitation input:
- Create a rain gage coverage.
- Create rain gages in their proper locations.
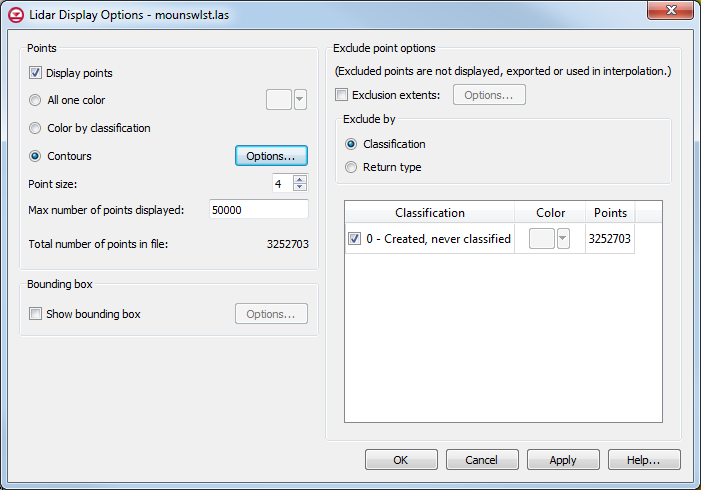
- Using the Select tool, double-click on the gage to bring up the Rain Gage Properties dialog.
- Set the gage type to GSSHA.
- Define the precipitation using either a cumulative or an incremental distribution.
- Beneath the Show drop-down, choose GAGES if your data is incremental, and ACCUM if your data is accumulative.
- Return to the 2D-Grid module and select GSSHA | Precipitation.
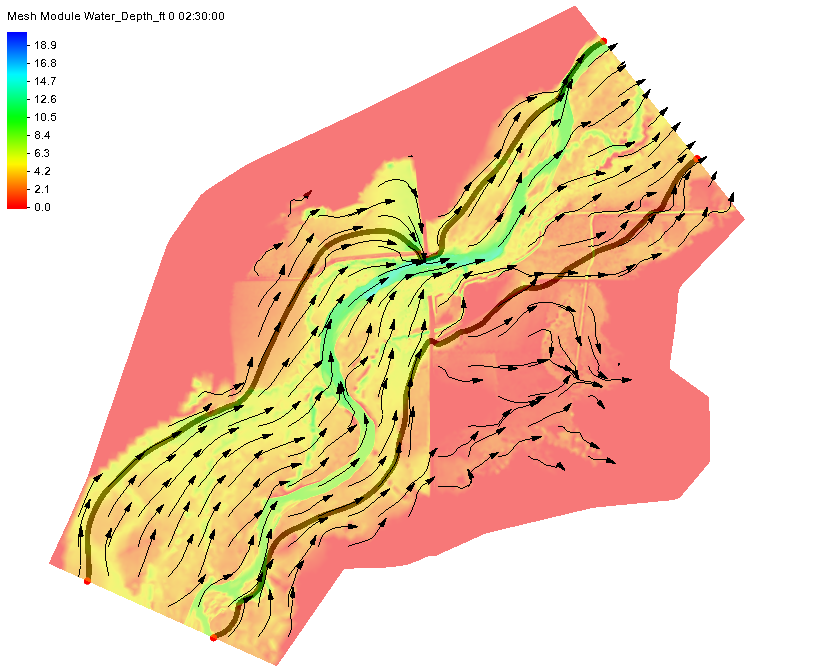
- Select Gage as the rainfall event, select Rain Gage, and choose your preferred interpolation method (Inverse distance weighted or Thiessen polygons).
For more information and specifics on working with gages in GSSHA, please take a look at the GSSHA user’s manual. WMS provides a useful and helpful resource when creating a GSSHA model, analyzing and viewing the results. Practice using rain gages as your precipitation source in WMS 11.0 today!
 macro in WMS to bring up the Hydraulic Toolbox.

 ]
]